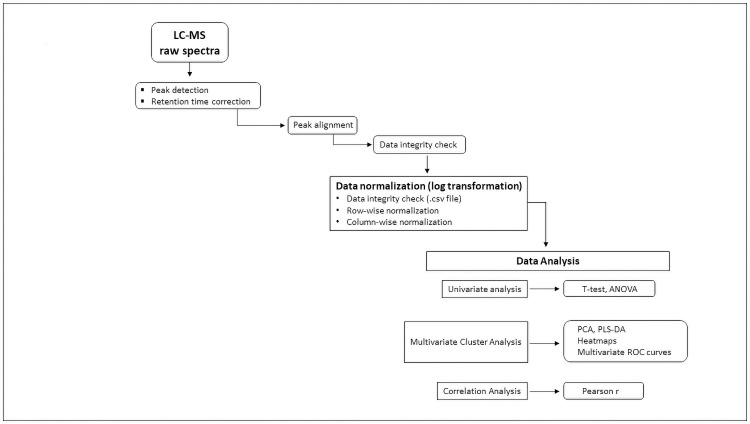
Fig 1. Flowchart illustrating workflow and data processing.
Individual metabolite absolute concentrations measured by targeted mass spectrometry (MS/MS) transmitted in.csv data-files were log transformed for normalization and then uploaded into MetaboAnalyst 5.0 bio-informatic data analytic platform. Univariate (t-test, ANOVA), multivariate (PCA, PLS-DA, Heatmaps, Multivariate ROC Curve Analysis) and correlation coefficients (Pearson r) then applied to identify metabolites and ratios associated with COVID-19.

