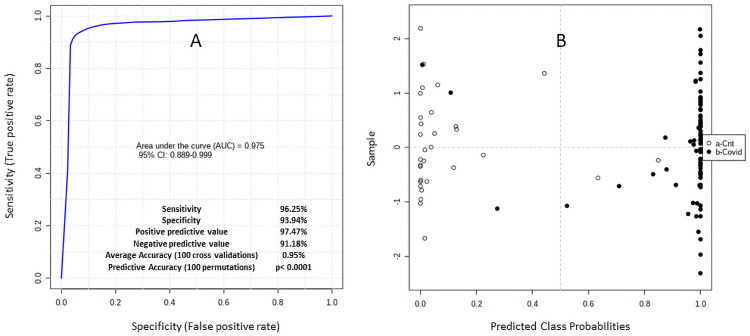
Fig 2.
(A, B) reflect unsupervised clustering analysis using the most discriminating ratios that segregate controls (n = 31) from COVID-19 (+) patients (n = 77). The average accuracy based on 100 cross validations is 0.95 with an ROC AUC = 0.975 (95% CI 0.889–0.999) and permutation test statistic: p<0.0001.

