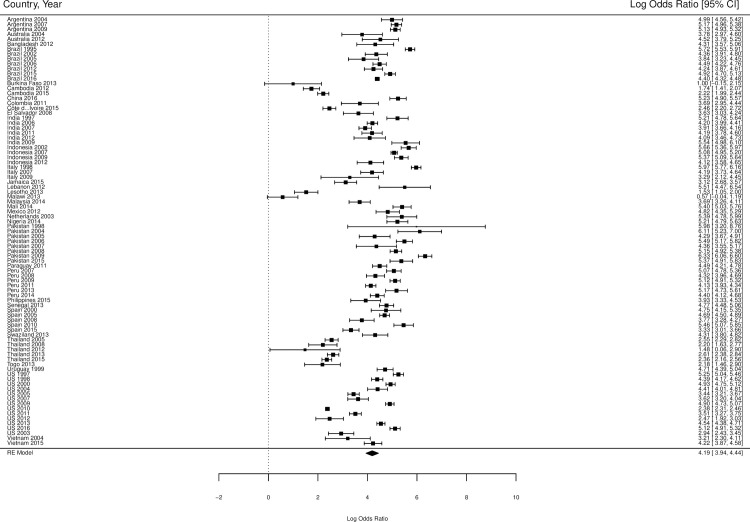
Fig 2. Forest plot of HIV prevalence in trans feminine individuals compared to all adults (age 15+).
The scale on the x-axis is log odds ratio. The percentages indicate the weight of each country by year within the meta-analysis. The numbers in the right column are the log odds ratios including their confidence intervals. We converted these log odds ratios into odds ratios, as described in Table 2.

