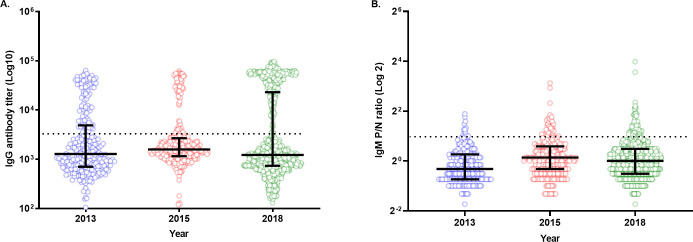
Fig 2. Distribution of anti-CHIKV IgG and IgM antibodies in 2013, 2015, and 2018.
(A) An anti-CHIKV IgG titer of ≥ 3000 was considered CHIKV-positive and is indicated by a black dotted line. (B) An anti-CHIKV IgM-positive/negative (P/N) ratio of ≥ 2.0 was considered IgM-positive and is denoted by a black dotted line. Each dot represents the sample distribution of IgG and IgM in the study population, and the black error bars denote the median and interquartile ranges in figures A and B, respectively.

