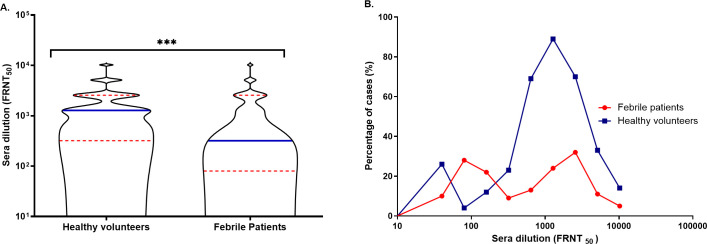
Fig 4. Distribution of CHIKV NAbs among healthy volunteers and febrile patients.
A) Distribution of NAbs was computed as a continuous approximation of the probability density using Kernel density estimation (KDE). The densities of both populations are annotated with the median (blue straight line) and the interquartile range (red dotted lines). The distribution of healthy volunteers’ NAbs shows the median of samples above the 103 titer. The probability density of febrile patients is concentrated below the 103 NAb titer. Statistical significance was measured with the Mann-Whitney U test, p = 0.007 is denoted by ***. B) Comparison of the proportion of the NAb titer in healthy volunteers (blue) and febrile patients (red).

