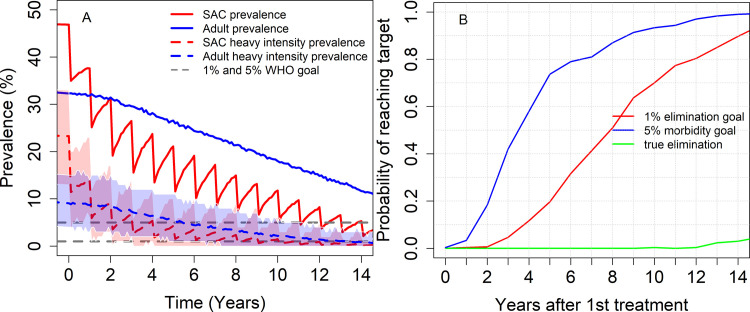
Fig 6. Model projections of annual MDA treatment of 75% school-aged children (SAC; 5–14 years of age) in moderate baseline transmission settings. δ = 0.002 is considered.
Graph (A) shows the prevalence of infection and heavy intensity prevalence in SAC and Adults over time and graph (B) shows the probability of achieving morbidity control and EPHP. Shaded areas (both blue and red) represent the 90% credible interval (90% of the simulated results fall within these shaded areas) for heavy-intensity prevalence in SAC and Adults. True elimination (interruption of transmission) is achieved when the incidence of new infections in a community is reduced to zero.

