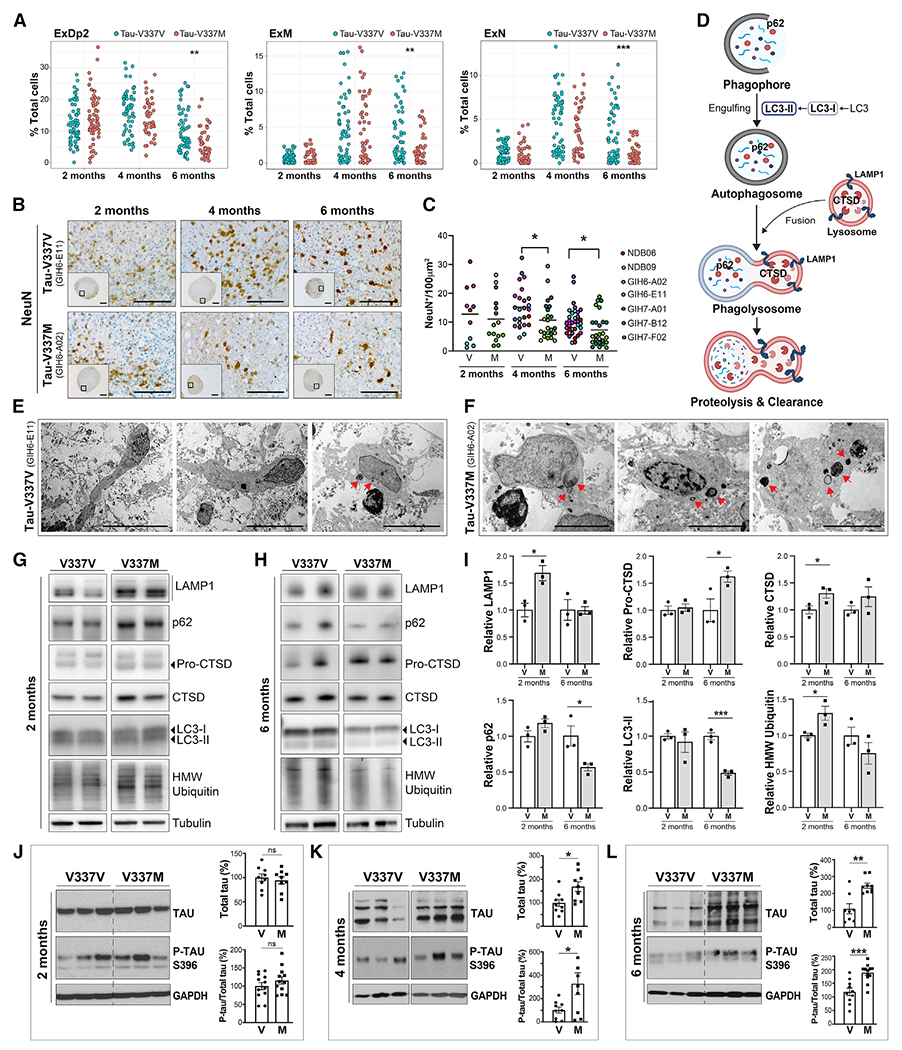
Figure 2. Tau-V337M organoids exhibit neuronal loss, early autophagy disruption, and progressive tau accumulation.

(A) Proportion of glutamatergic neurons (ExDp2, ExM, and ExN) per organoid at 2, 4, and 6 months. Linear model, **p < 0.01, ***p < 0.001.
(B and C) Imaging and quantification of neuronal density by NeuN+ over time in tau-V337M and isogenic V337V organoids. Mann-Whitney test, *p < 0.05. Scale bars, 250 μm (insets) and 50 μm.
(D) Schematic of the ALP and key markers.
(E and F) Electron photomicrographs of neurons in 2-month-old tau-V337V (E) and V337M (F) organoids. Lamellar bodies are indicated by red arrows. Scale bars, 50 μm (E) and 5 μm (F).
(G–I) Western blot and densitometry quantification of ALP markers in tau-V337M and isogenic organoids at 2 (G) and 6 months (H). Relative densitometry ± SEM. Unpaired t test, *p ≤ 0.01, ***p ≤ 0.0001; n = 3 organoids per group.
(J–L) Western blot and densitometry quantification of total tau and P-tau S396 levels in tau-V337M and isogenic V337V organoids at 2 (J), 4 (K), and 6 (L) months. Bars represent mean total tau densitometry or P-tau/total tau in mutant organoids (%) relative to isogenic controls (100%) ± SEM. Two-tailed unpaired t test, *p ≤ 0.01, **p ≤ 0.001, *p ≤ 0.0001; ns, non-significant; n = 9 per group from 3 independent experiments.
See also Figures S2 and S3.
