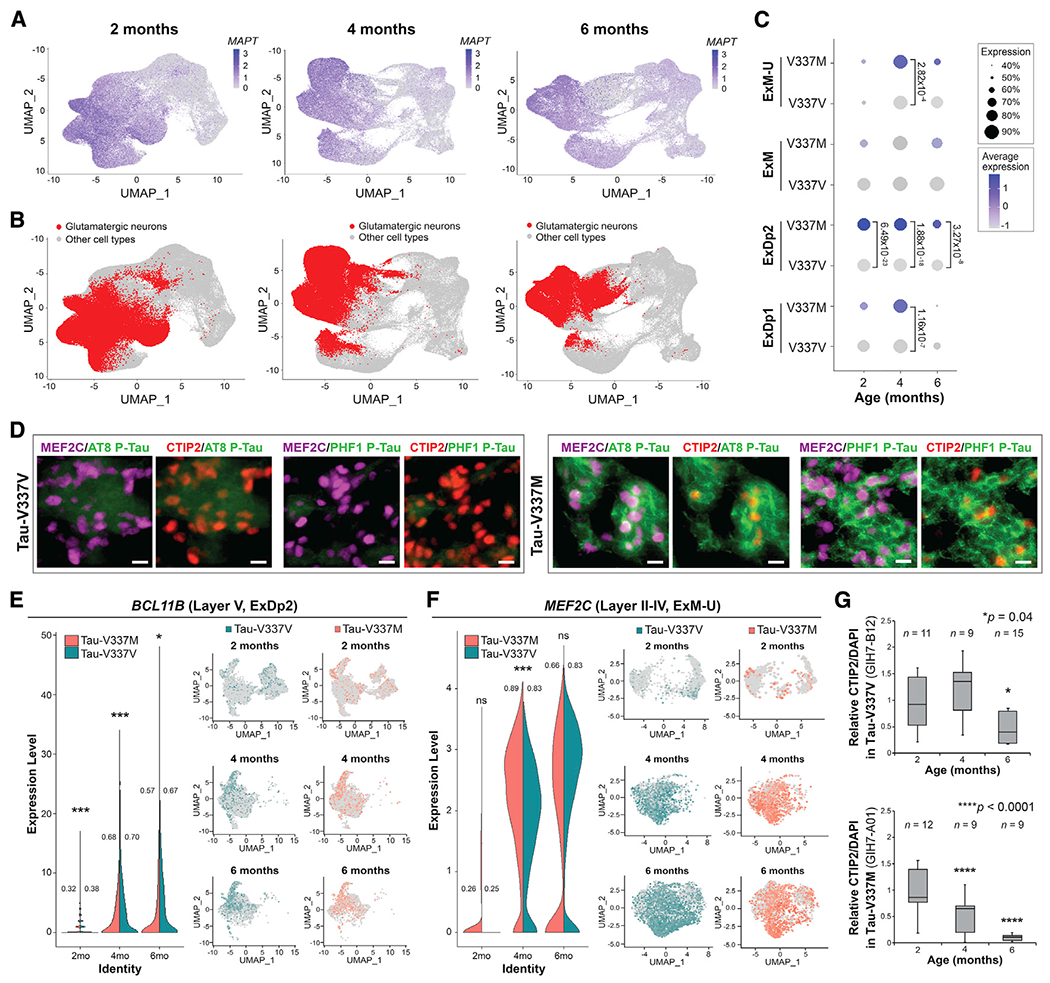
Figure 3. Tau-V337M organoids reveal loss of deep- and upper-layer glutamatergic neurons.

(A and B) Expression of MAPT (A) and glutamatergic neuronal subtypes (ExDp1, ExDp2, ExM, and ExM-U) (B) projected onto scRNA-seq UMAPs at 2, 4, and 6 months.
(C) Proportion of MAPT-expressing glutamatergic neuronal subtypes over time by mutation. Expression is scaled within each time point. Dot size, proportion of MAPT-expressing cells; color depth, MAPT expression level. Values: differential gene expression p value adjusted by model-based analysis of single-cell transcriptomics (MAST) general linear model comparisons of differential expression.
(D) BCL11B/CTIP2 and MEF2C in tau-V337M (right) and isogenic V337V (left) 6-month organoids colocalized with P-tau S202/T205 (AT8) and P-tau S396/S404 (PHF1) staining. Scale bar, 10 μm.
(E and F) Proportion of V337M and V337V ExDp2 neurons expressing the layer V marker BCL11B/CTIP2 (E) or ExM-U neurons expressing the layer II–IV marker MEF2C (F) at each time point; values: proportion of cells expressing each gene. MAST general linear model, *p < 0.05 **p < 0.01 ***p < 0.001 between V337M and V337V neurons. Shown are UMAPs of gene expression in ExDp2 neurons (E) or ExM-U neurons (F) at each time point.
(G) Time-course image quantitative analysis of BCL11B/CTIP2+ neurons at 2,4, and 6 months normalized to DAPI. n ≥ 3 organoids from 3 separately generated organoid batches (representative image shown in D). n = number of organoids. One-way ANOVA, Tukey post hoc test, *p < 0.05, ****p < 0.0001.
