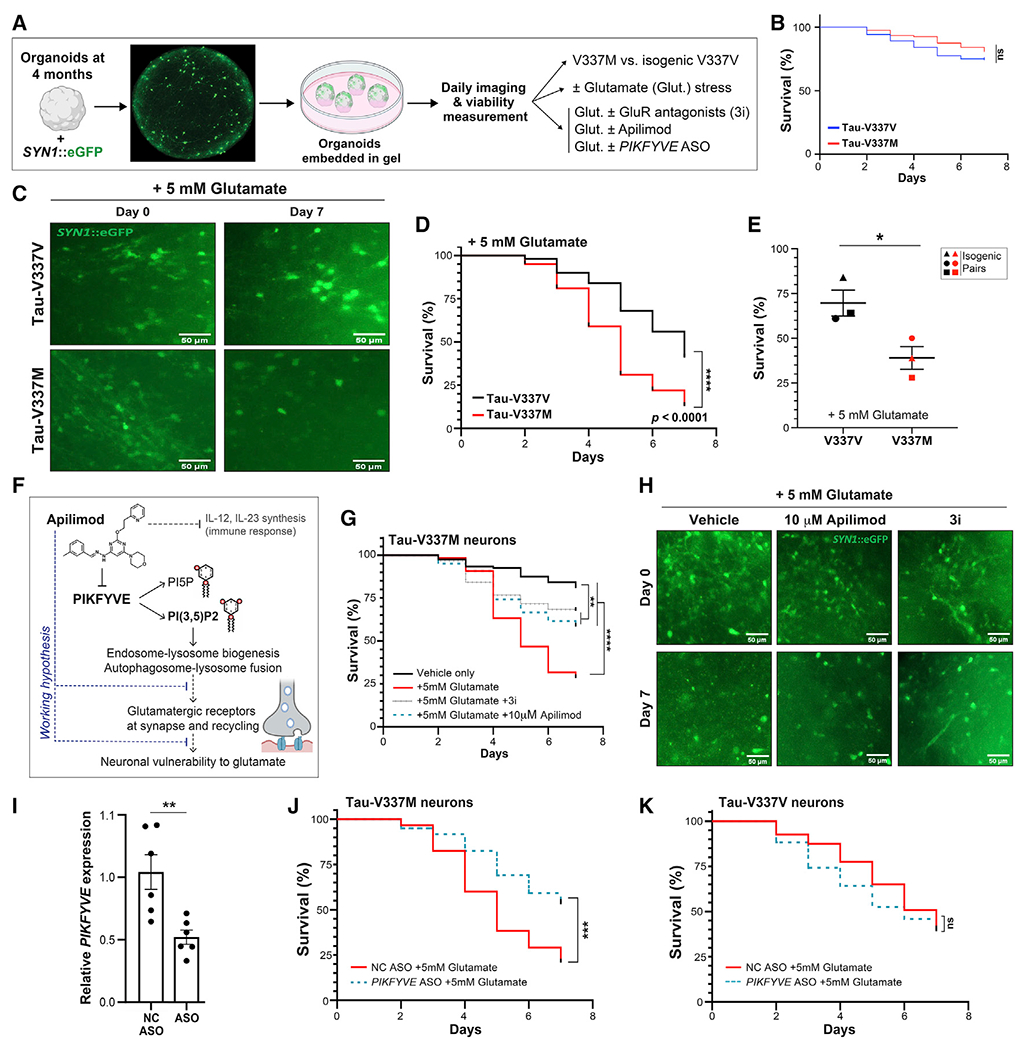
Figure 7. Tau-V337M susceptibility to glutamate excitotoxicity is reversed by antagonists of excitatory receptors and PIKFYVE inhibition.

(A) Longitudinal imaging method for tracking neuronal survival in cerebral organoids.
(B) Survival of SYN1::GFP+ neurons in 4-month tau-V337M and isogenic V337V organoids without glutamate treatment. n = 80 neurons from 5 organoids per group. Log rank test. ns, not significant
(C) Images of 4-month tau-V337M and isogenic V337V organoids treated with 5 mM glutamate. Neurons labeled with a lentivirus encoding SYN1::GFP. Scale bars, 50 μm.
(D) Survival of SYN1::GFP+ neurons in tau-V337M and isogenic V337V 4-month organoids with glutamate treatment. n = 100 neurons from 5 individual organoids per group. Log rank test. ****p < 0.0001.
(E) Percentage of surviving neurons following 7 days of glutamate treatment from 3- to 4-month organoids. Each point represents an independent experiment among three isogenic pairs. Two-tailed unpaired t test, *p = 0.0436.
(F) Schematic of the proposed mode of action for apilimod and effect on neuronal vulnerability to excitotoxic stress.
(G) Survival of SYN1::GFP+ neurons in tau-V337M organoids with glutamate treatment and DMSO. 3i, 10 μM CNQX + 10 μM MK-801 + 2 mM nimodipine or 10 μM apilimod. n = 120 neurons from 5 individual organoids per group. Log rank test, **p < 0.01 ****p < 0.0001.
(H) Images of 4-month tau-V337M organoids treated with 5 mM glutamate and DMSO. 3i, 10 μM CNQX + 10 μM MK-801 + 2 μM nimodipine or 10 μM apilimod. Neurons were labeled with SYN1::GFP. Scale bars, 50 μm.
(I) Relative PIKFYVE expression in ND03231 organoids by qRT-PCR following treatment with a PIKFYVE ASO, normalized to 18S expression. Bars represent mean expression ± SEM with n = 6 organoids per group. Two-tailed unpaired t test, **p < 0.01.
(J and K) Survival of SYN1::GFP+ neurons in 4-month tau-V337M (J) and tau-V337V (K) organoids with glutamate and 10 μM negative control (NC) or PIKFYVE ASO treatment. n = 120 neurons from 5 individual organoids per group. Log rank test, ***p = 0.001, ****p < 0.0001.
See also Figure S7.
