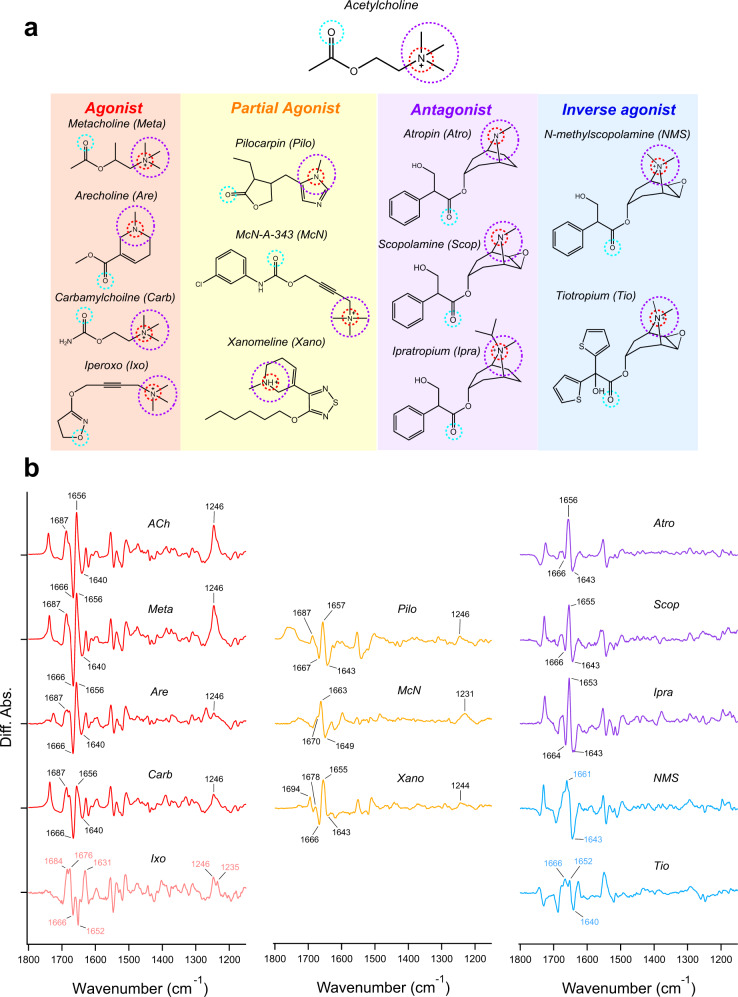
Fig. 1. Ligand binding-induced difference ATR-FTIR spectra measurement on ligands with different efficacies for M2R.
a Chemical structures of the ligands used in the ATR-FTIR spectroscopy measurements. Common features among each ligand are marked by dashed circles. b Ligand binding-induced difference ATR-FTIR spectra of M2R bound with various ligands at 293 K. Red, orange, purple, and cyan lines correspond to agonist-, partial agonist-, antagonist-, and inverse agonist-bound spectra measured in H2O, respectively. Positive and negative bands originate from ligand-bound and ligand-unbound states, respectively. One division of the y-axis corresponds to 0.002 absorbance unit.

