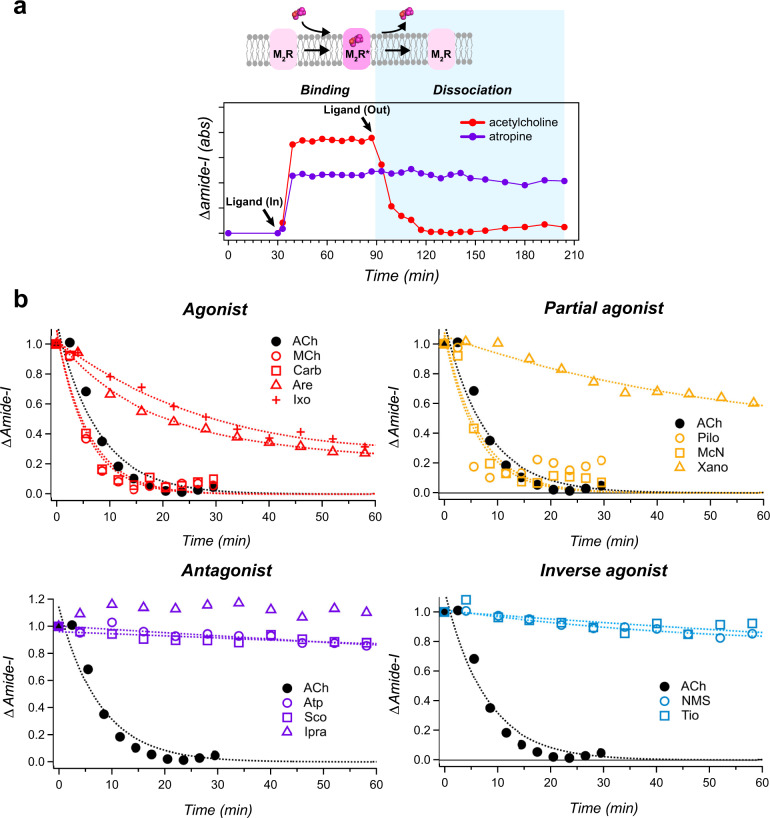
Fig. 4. Ligand-dependent dissociation kinetics on M2R.
a Time trace of the integrated absorbance signal in the amide-I band (red circle, ACh; purple circle, Atro) taken from Katayama et al.35. Each ligand (1 mM concentration) is added at 30 min time point and is washed out at 90 min time point by exchanging to the buffer without ligand at a flow rate of 0.6 mL min−1 through a flow cell, of which the temperature is maintained at 20 °C by circulating water. The arrows in the illustration mark the time points of ligand-In and ligand-out via buffer exchange, respectively. Ligand dissociation phase is highlighted by light blue. b Time trace of the integrated absorbance signal at dissociation phase in the amide-I band for each ligand. Time-dependent difference ATR-FTIR spectra upon ligand dissociation in the amide-I region (1680–1630 cm−1) are shown in Supplementary Fig. 10. Black red, orange, purple, and cyan correspond to ACh, agonist, partial agonist, antagonist, and inverse agonist, respectively. Dotted lines represent the fitting curve obtained by single exponential function.

