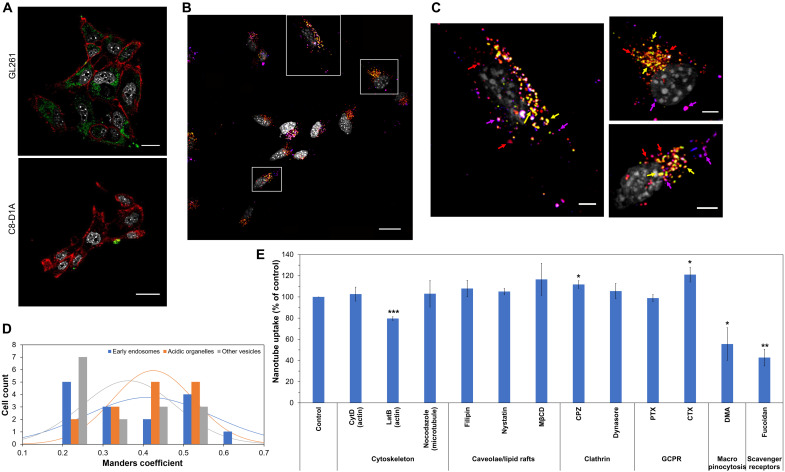
Fig. 2. Preferential uptake of nanotubes by GL261 GBM cells via the macropinocytosis pathway and scavenger receptors.
(A) Confocal microscopy of HEX-labeled nanotubes (green) after incubation with GL261 GBM cells and C8-D1A normal astrocytes for 24 hours at 37°C. Nuclei are shown in gray and cell membranes in red. Scale bars, 20 μm. (B) Maximum-intensity projection of a confocal microscopy image of HEX-labeled nanotubes (red) after incubation with GL261 cells for 24 hours at 37°C. Nuclei are shown in gray, early endosomes are shown in blue, and acidic organelles are shown in green. Colocalization of nanotubes with early endosomes is shown in magenta and with acidic organelles in yellow. Scale bar, 20 μm. (C) Zoom-in images of the square areas shown in (B). Magenta, yellow, and red arrows point to select areas of nanotube colocalization with early endosomes, acidic organelles, and other vesicles that were not labeled, respectively. Scale bars, 5 μm. (D) Manders coefficient values quantify the different levels of colocalization between nanotubes and early endosomes, acidic organelles, and vesicles not labeled (n = 15). (E) GL261 association of nanotubes in the presence of different endocytosis inhibitors. Data are shown as means ± SD (n = 3). Statistical significance with that of the control (incubation with nanotubes in the absence of inhibitors) was determined using a two-sided unpaired t test; *P < 0.05, **P < 0.01, and ***P < 0.005. There was no significant statistical difference for all other treatments (P > 0.05).

