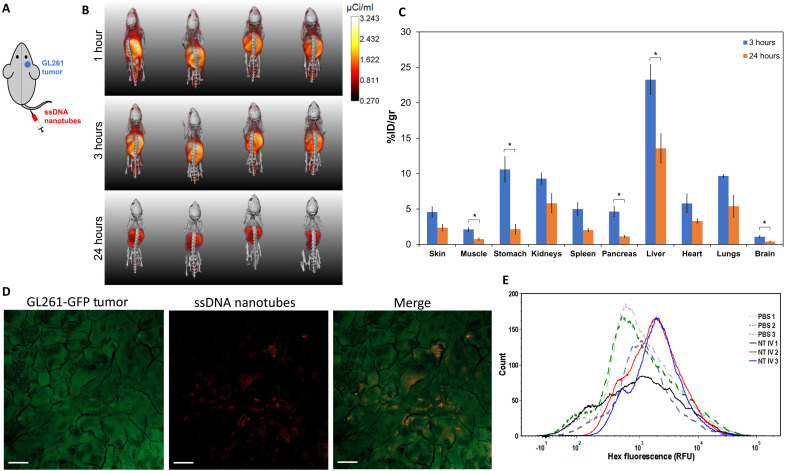
Fig. 4. Nanotube biodistribution and BBTB crossing.
(A) Schematic of intravenous injection of nanotubes to a mouse with GL261 tumor on the right hemisphere of the brain. (B) Full body volumetric 3D reconstruction of μPET/CT mice imaged at 1, 3, and 24 hours after intravenous injection of 64Cu-radiolabeled nanotubes. The μPET intensity scale bar for all images has units of microcuries per milliliter, and the intensity of the μPET signal was not adjusted for the half-life of 64Cu. (C) Ex vivo biodistribution of 64Cu-labeled nanotubes at 3 or 24 hours after intravenous injection to mice bearing GL261 orthotopic tumors. Radioactivity and weights of different organs were measured, and data were adjusted for the 12.7 hours half-life of 64Cu and plotted as means ± SEM (n = 3 to 4). Statistical significance was determined using a two-sided unpaired t test; *P < 0.05. There was no significant statistical difference for pairs without brackets (P > 0.05). (D and E) Mice bearing orthotopic tumors of GL261 cells expressing GFP (GL261-GFP) were injected intravenously with HEX-labeled nanotubes. Mice were euthanized 6 hours after nanotube injection, and tumor tissues were removed and processed for confocal microscopy (D) and flow cytometry (E). (D) Maximum-intensity projection of a confocal microscopy image showing colocalization of GL261-GFP cells (green) with the HEX-labeled nanotubes (red). Scale bars, 20 μm. (E) Flow cytometry plots from GL261-GFP tumors from mice that were intravenously injected with PBS or HEX-labeled nanotubes (NT IV).

