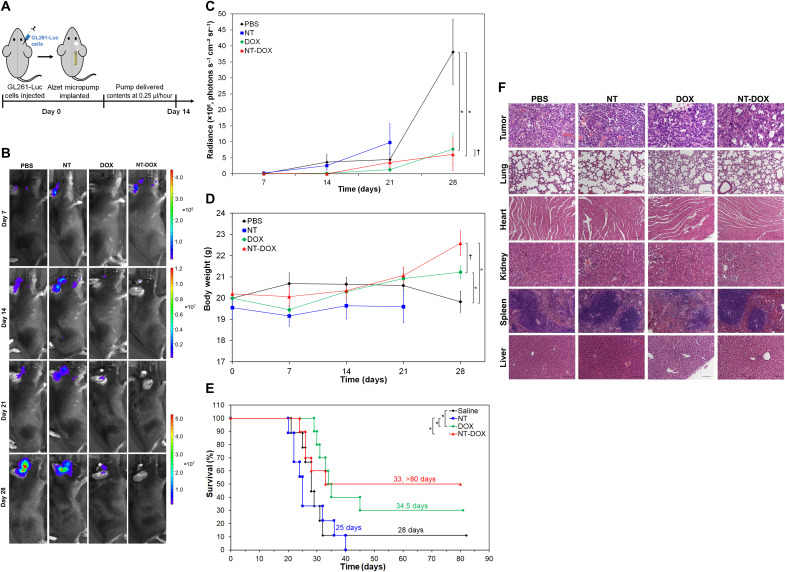
Fig. 5. Local brain delivery of DOX and nanotubes intercalating DOX.
(A) Preparation and treatment schedule of mice. The right side of the brain was injected with 3 × 10⁴ GL261-Luc cells on day 0. Immediately after that, a micro-osmotic Alzet pump was implanted subcutaneously, and the cannula, connected to the pump through a catheter, was lowered into the same burr hole used to inject the cells. The pumps were loaded with either PBS, 70 μM DOX (0.2 mg DOX/kg mouse), nanotubes (NT) at 95 μM ssDNA-amphiphiles, or NT-DOX at the same concentrations of DOX and amphiphiles and delivered their content in about 14 days at a pumping rate of 0.25 μl/hour. (B) Representative bioluminescence images of mice at different time points. Scale bars are shown on the side. (C) Quantification of tumor bioluminescence values in the different treatment groups over time. (D) Body weight of mice in different groups during treatment. In (C) and (D), data are shown as means ± SEM (n = 9 to 10). For the NT group, data are not reported on day 28 as only three mice were alive. Statistical significance on day 28 was determined using a two-sided unpaired t test; †P > 0.05 and *P < 0.05. (E) Survival curves corresponding to the different treatment groups (n = 9 to 10). Statistical significance was determined using a two-sided log-rank test; *P < 0.05. There was no significant statistical difference for pairs without brackets (P > 0.05). (F) Representative images of hematoxylin and eosin staining of tumors and other organs from mice that received different treatments. Images were taken with 20× objective lens. Scale bars, 100 μm.

