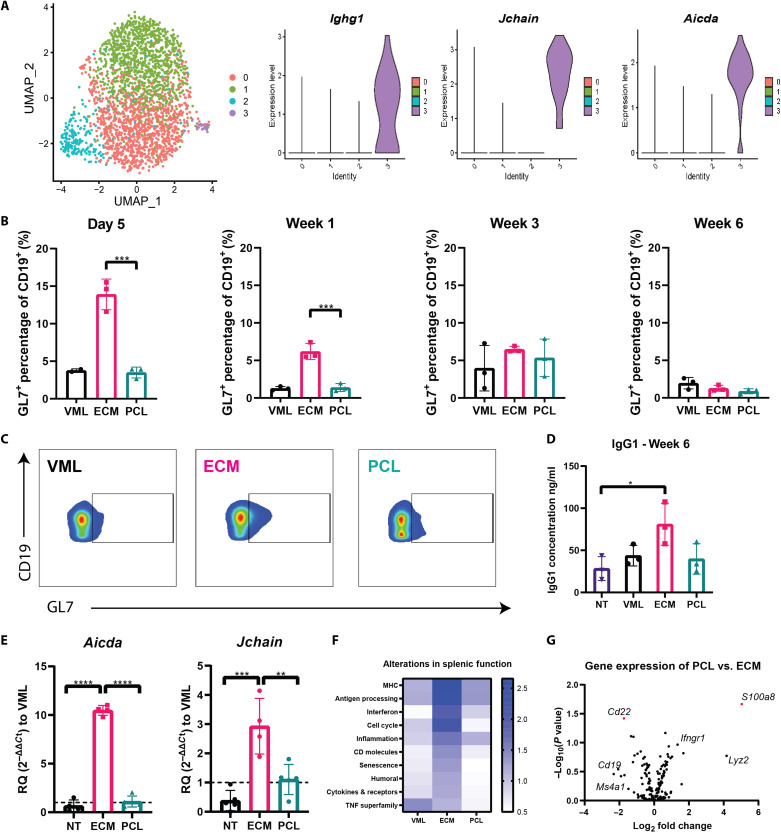
Fig. 2. ECM induces germinal center formation.
(A) Dimensional reduction projection of B cells onto two dimensions using UMAP. Cells are colored by cluster. Violin plots of cluster gene expression of surface markers identified by differential expression analysis demonstrating genes highly expressed in cluster 3 associated with germinal center formation. (B) Flow cytometry counts of GL7+ B cells (defined as GL7+CD19+) in the draining LN following injury ± biomaterial shown as bar graphs for each time point. (C) Flow cytometry plots of day 5 GL7 on B cells comparing VML, ECM, and PCL. (D) Gene expression using qRT-PCR at 1-week expression of Aicda and Jchain compared to VML. (E) Serum analysis of IgG1 at 6 weeks after injury. (F) Heatmap of NanoString pathway scores in which the scale reflects the z score of each pathway at 3 weeks after injury in the spleen. (G) Volcano plot of PCL to ECM gene expression differences, where S1008a and Cd22 are divergently regulated. Data are means ± SD, n = 4, one-way ANOVA with subsequent multiple comparison testing. (C) ****P < 0.0001, ***P < 0.001, **P < 0.01, *P < 0.05. VML indicates injury with saline, ECM indicates injury with ECM, and PCL indicates injury with PCL.

