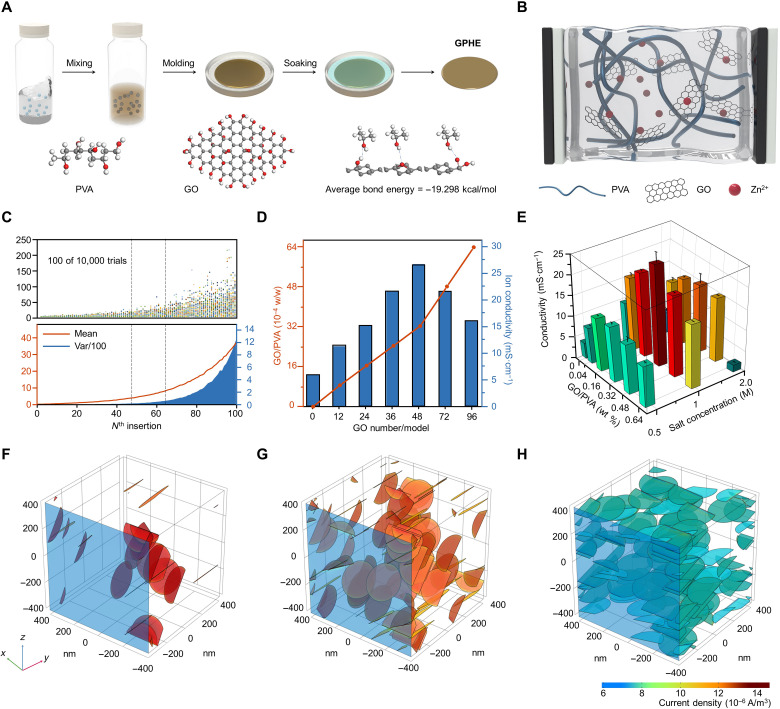
Fig. 1. Fabrication of GPHE.
(A) Schematic diagram of the preparation process of GPHE. The inner image is the schematic diagram of three kinds of hydrogen bond formation between PVA and GO. (B) Schematic diagram of the ion-conducting process of GPHEs. (C) Monte Carlo simulation result of GO distribution state in PVA matrix. (D) Calculation results of ion conductivity of GPHEs with different GO mass. (E) Measurement ion conductivity of GPHEs with different PVA-GO mass ratios and soaking concentrations. (F to H) Maximum conductivity of models and calculation analysis of GPHEs, (F) with small GO mass, (G) with moderate GO mass, and (H) with excessive GO mass.

