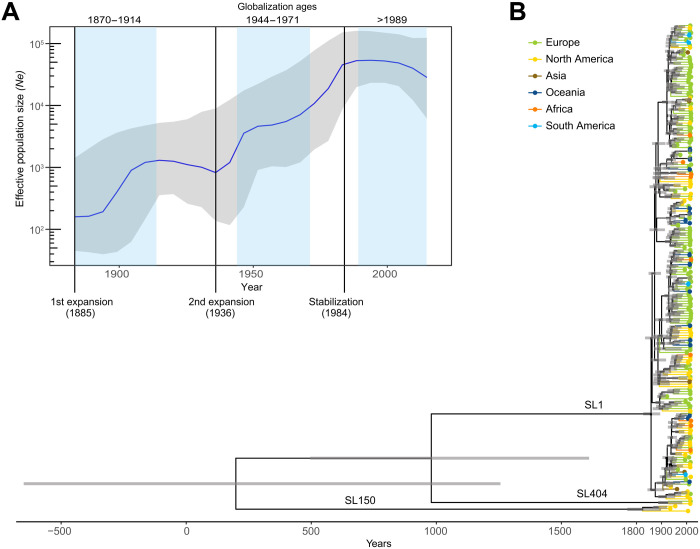
Fig. 3. Bayesian temporal and demographic analyses on a representative 200 isolate dataset of Lm-CC1.
(A) Bayesian skyline plot (BSP) with the estimation of Lm-CC1 effective population size (Ne). The y axis refers to the predicted number of individuals (log scale), and the x axis refers to the time scale (in years). The median population size is marked in blue, with its 95% high posterior density (HPD) in gray. Blue vertical panels delimitate the three globalization ages (1870–1914, 1944–1971, and 1989–present). (B) Bayesian time-calibrated tree. Nodes represent the estimated mean divergence times, and gray bars represent the 95% HPD CIs of node age. Scale indicates time (in years). Terminal branches and tips are colored by continents, as indicated in the key panel.

