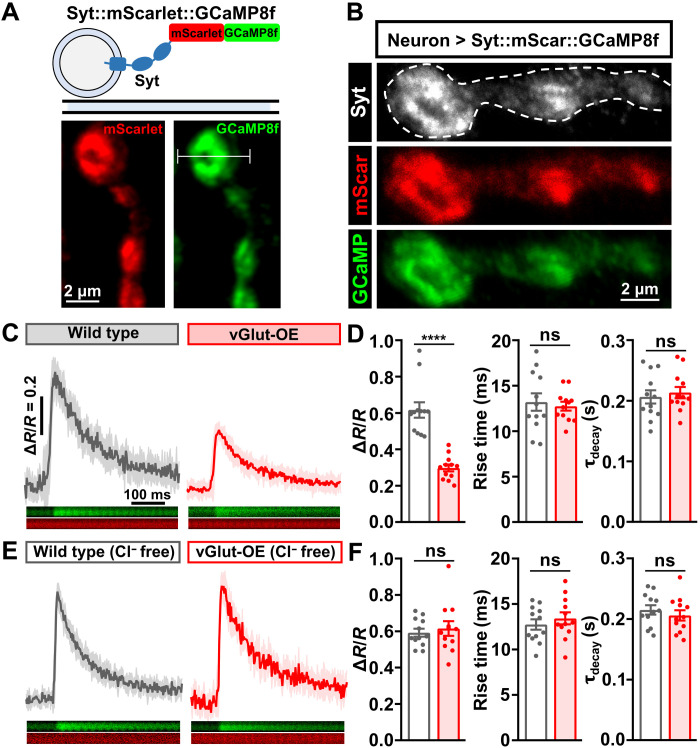
Fig. 8. PHD is achieved through a Cl−-dependent reduction in presynaptic Ca2+.
(A) Schematic and live confocal images of the Syt::mScarlet::GCaMP8f ratiometric Ca2+ reporter. The white line indicates a line scan across a single bouton. (B) Representative images of NMJ boutons stained with anti-Syt and endogenous signals of mScarlet and GCaMP8f. (C) Representative averaged trace of single action potential–evoked Ca2+ transients (ΔR = F488/F561) across time normalized to the baseline F488/F561 ratio (R) before stimulation in the indicated genotypes: wild type (w;OK371-GAL4/+;UAS-syt-mScarlet-GCaMP8f/+) and vGlut-OE (w;OK371-GAL4/UAS-vGlut;UAS-syt-mScarlet-GCaMP8f/+). SEM of 10 independent single action potential–evoked traces is shown in the shaded area (wild type, n = 12; vGlut-OE, n = 12). (D) Quantification of ΔR/R, rise time (10 to 90% to peak), and decay time constant (τdecay) at individual boutons in the indicated genotypes in (C). ****P < 0.0001. (E) Representative averaged trace of the same experiment and genotypes shown in (C) in 0 Cl− HL3 saline (wild type, n = 12; vGlut-OE, n = 12). (F) Quantification as described in (D) but of the data shown in (E).

