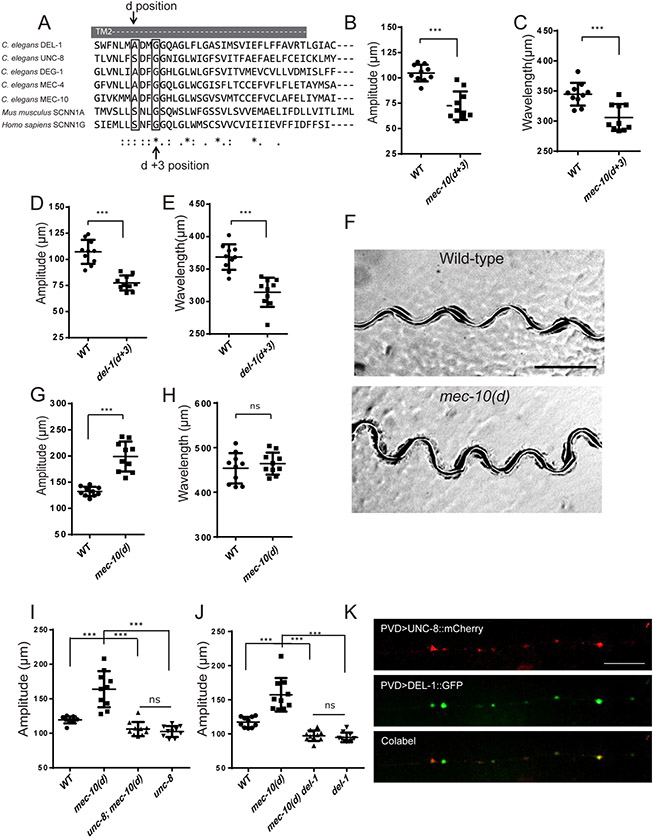
Figure 2. MEC-10, DEL-1 and UNC-8 are interdependent and function together to regulate movement.
(A) Sequence alignment of the second transmembrane region (TM2) of mouse, human, and worm DEG/ENaC/ASICs channels. (B-E) Quantification of amplitude and wavelength of tracks in mec-10(d+3) (B and C) and del-1(d+3) (D and E) mutants. del-1(d+3) is del-1(wy1117). mec-10(d+3) is mec-10(u20). (F) Representative tracks of wt and mec-10(d) mutants. mec-10(d) is mec10(wy1112). Scale bar, 500 μm. (G-H) Quantification of amplitude and wavelength of tracks for wt and mec-10(d). (I-J) The increased amplitude of mec-10(d) was suppressed by unc-8(e15lb145) (I) or del-1(ok150) (J) mutants. For (B-E), (G-J), Data are represented as mean ± SD. Each dot represents a single worm. 10 animals were quantified for each genotype. Student’s T-test was used for statistical analysis. *** p<0.001. ns: not significant. L4 worms were used in (B-E). Day 1 young adult worms were used in (G-J). (K) Co-localization of UNC-8::mCherry (red) and DEL-1::GFP (green) in PVD dendritic puncta. The primary PVD dendrite is shown. n>9. Scale bar, 10 μm. See also Figure S2.

