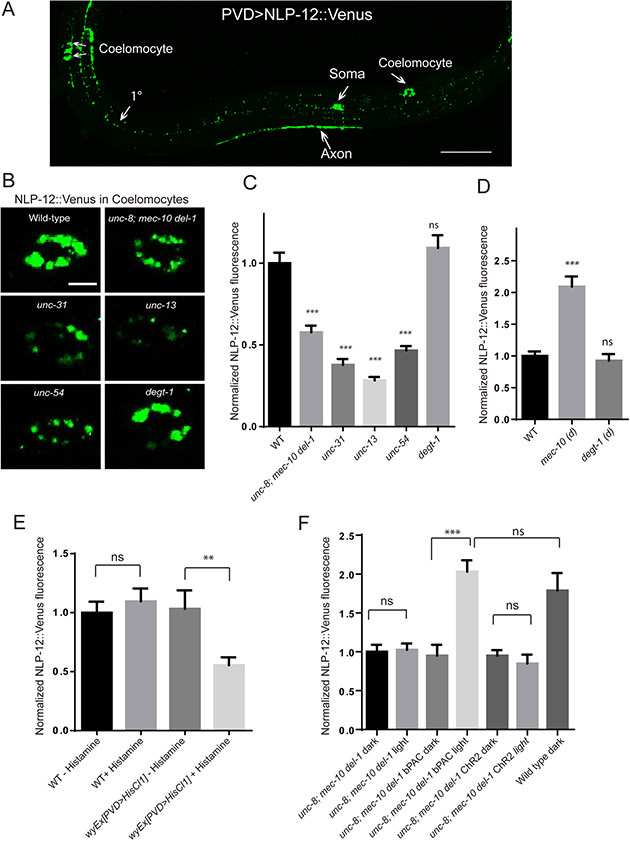
Figure 6. NLP-12 secretion from PVD requires DEG/ENaC/ASICs and muscle function.
(A) A confocal image of NLP-12::Venus fluorescence expressed in the PVD neuron in wt animals. Scale bar, 50 μm. (B) Representative images of a single coelomocyte of wt, unc-8(e15lb145); mec-10(tm1552) del-1(ok150) triple, unc-31(e928), unc-13(s69), unc-54 (e190) and degt-1(ok3307) mutants expressing NLP-12::Venus in PVD neurons. Scale bar, 5 μm. (C) Quantification of fluorescent intensity (normalized to wt) measured from the posterior dorsal coelomocytes of wt (n=42), unc-8(e15lb145); mec-10(tm1552) del-1(ok150) triple(n=31), unc-31(e928) (n=32), unc-13(s69) (n=30), unc-54(e190) (n=30) and degt-1(ok3307) (n=37) mutants expressing NLP-12::Venus in PVD neurons. (D) Quantification of coelomocytes NLP-12::Venus fluorescent intensity (normalized to wt) in wt (n=39), mec-10(d) (n=21)and degt-1(d) (n=19) mutants. mec-10(d) is mec10(wy1112). degt-1 (d) is degt-1(wy1283). (E) Quantification of coelomocytes NLP-12::Venus fluorescent intensity (normalized to wt without histamine) in wt and wyEx[PVD>HisCl1] transgenic worms treated with histamine or without histamine. n>12 for each genotype. (F) Quantification of coelomocytes NLP-12::Venus fluorescent intensity under dark or photostimulated conditions in unc-8; mec-10 del-1 mutants with bPAC or ChR2 expressing in PVD and wt animals. Fluorescence was normalized to dark condition of unc-8; mec-10 del-1 mutants. n>10 for each condition. For (C-F), One-way ANOVA with a Tukey correction was used for statistical analysis. ***p<0.001. Data are represented as mean ±SEM. ns: not significant.

