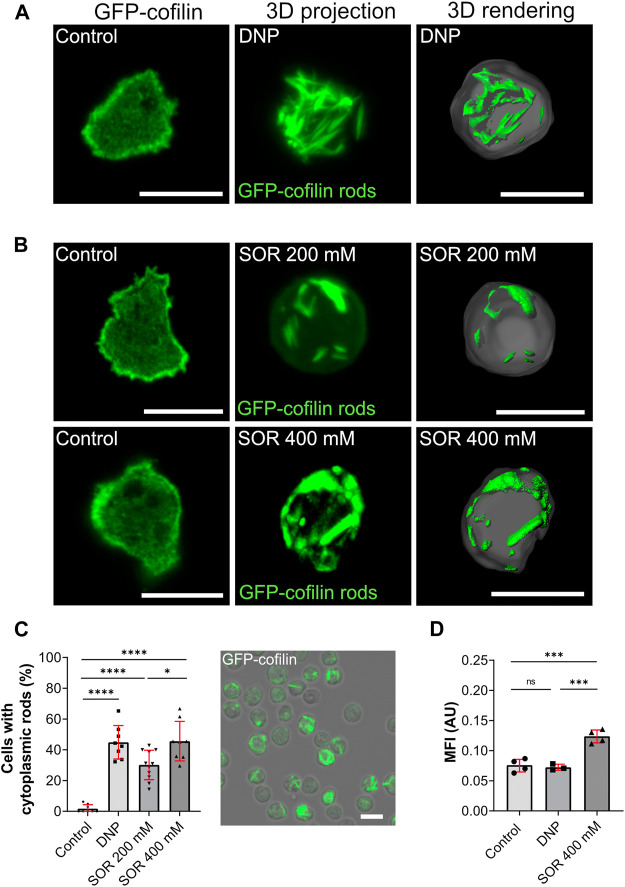
FIGURE 3.
Cytoplasmic actin-cofilin rods induced by DNP or hyperosmotic shock. (A) Non-treated cells (vehicle control), 3D projection and image rendering of rods formed by GFP-cofilin expressing cells treated with 200 µM DNP for 2 h. Scale bar, 10 µm. (B) Fluorescent images of non-treated GFP-cofilin expressing cells (vehicle control) and cytoplasmic actin-cofilin rods induced by treatment with 200 or 400 mM sorbitol (SOR). Scale bar, 10 µm. (C) Percentage of cells with rods after treatment with DNP or sorbitol for 2 h. Fluorescence image on the right shows a representative overview used for quantification (212 × 212 µm). For each experiment (n > 6), 10x overview images were quantified. Scale bar, 10 µm. (D) Ratiometric fluorescence measurements show a drop in the intracellular pH after treatment with 400 mM sorbitol for 2 h. Histograms depict median fluorescence intensity (MFI). More acidic values result in higher MFI. Error bars are median with interquartile range (red). Samples were considered significant when p ≤ 0.05. Welch´s t-test was applied. n = 3-4 experiments; more than 20 cells were analyzed per experiment, and the average of fluorescence intensity was determined.

