
FIGURE 5.
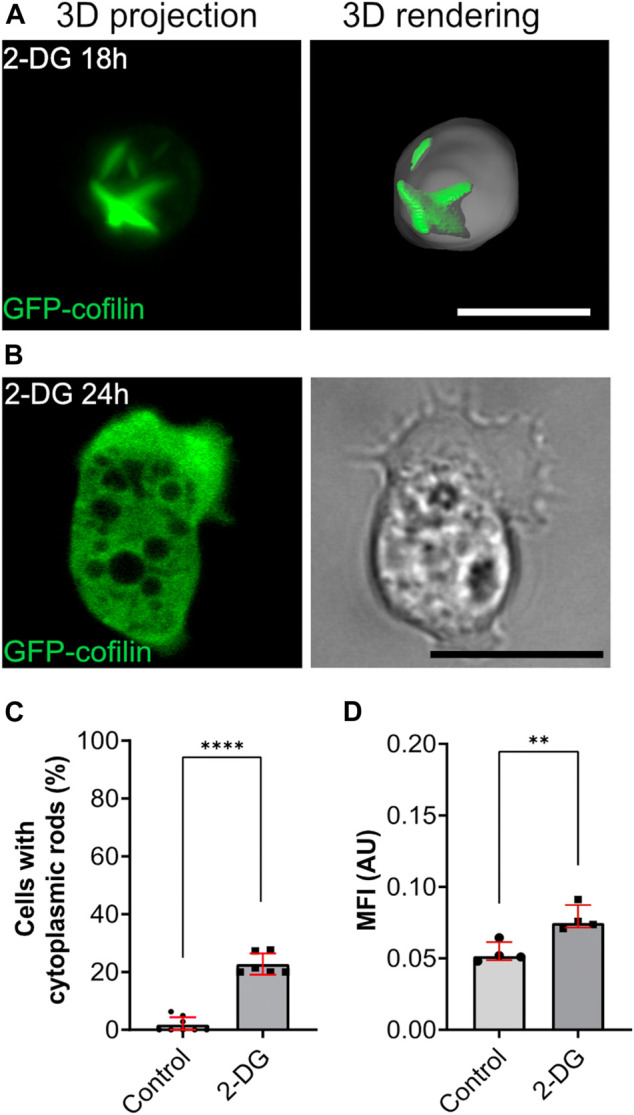
Starvation induced by glucose-deprivation (2-DG) causes transient formation of cytoplasmic actin-cofilin rods. (A) 3D projection and rendering of GFP-cofilin expressing cells treated with 2-DG for 18 h, or (B) 24 h. Scale bars, 10 µm. (C) Percentage of cells with cytoplasmic rods after 18 h of glucose deprivation. For each experiment, 10x images (212 × 212 µm) were used for quantification (n = 6). (D) Ratiometric pH measurements 18 h after incubation of cells in 2-DG-containing medium. For each experiment, 10x images (212 × 212 µm) with a total of more than 20 cells per experiment were analyzed to determine the mean of fluorescence intensity (n = 4). Error bars are median with interquartile range (red). Samples were considered significant when p ≤ 0.05. Welch´s t-test was applied.