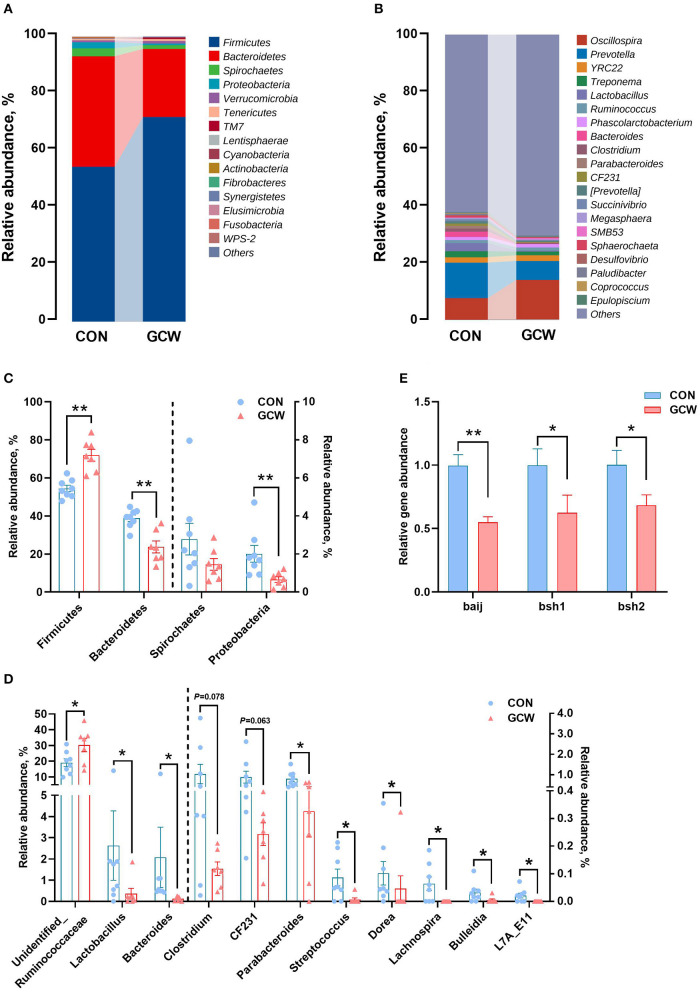
Figure 2.
Gut microbiota composition profiles. Bar plot showing relative abundance of microbiota at the phylum (A) and genus (B) levels for the control and GCW groups. Different levels of bacteria at the phylum (C) and genus (D) levels between control (n = 8) and GCW (n = 7) groups. (E) Relative abundance of genes involved in bile acid 7α-dehydroxylation (baij) and bile salt hydrolysis (bsh1 and bsh2) between control (n = 15) and GCW (n = 14) groups. Data are presented as means ± SEM. *p < 0.05, **p < 0.01.

