Figure 2.

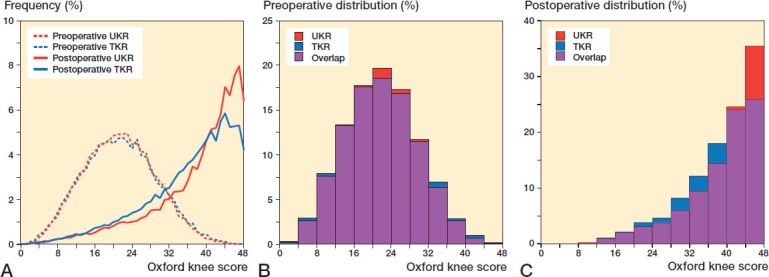
Distribution of OKS in TKR and UKR groups: (A) preoperative and postoperative line graph; (B) preoperative histogram; (C) postoperative histogram.

Distribution of OKS in TKR and UKR groups: (A) preoperative and postoperative line graph; (B) preoperative histogram; (C) postoperative histogram.