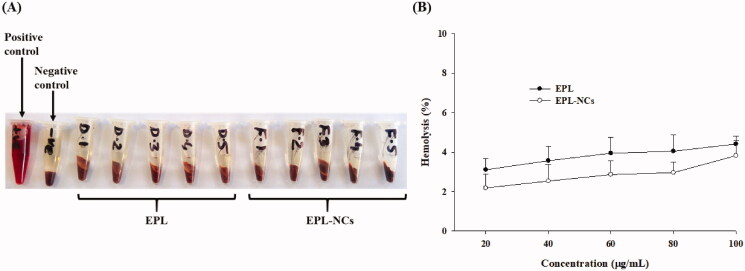
Figure 8.
Blood hemolysis by the optimized EPL-NCs indicated with real-time photographs of RBCs samples (A) and quantified with spectroscopic analysis of hemoglobin at 541 nm (B). The RBCs were mixed with Triton X-100 solution (positive control), isotonic PBS (negative control), 20, 40, 60, 80, and 100 µg/mL of EPL (D-1 to D-5) and 20, 40, 60, 80, and 100 µg/mL of EPL-NCs (F-1 to F-5), respectively. For the quantification of hemolysis (%), data are presented as mean ± S.D. (n = 3).

