
Figure 3.
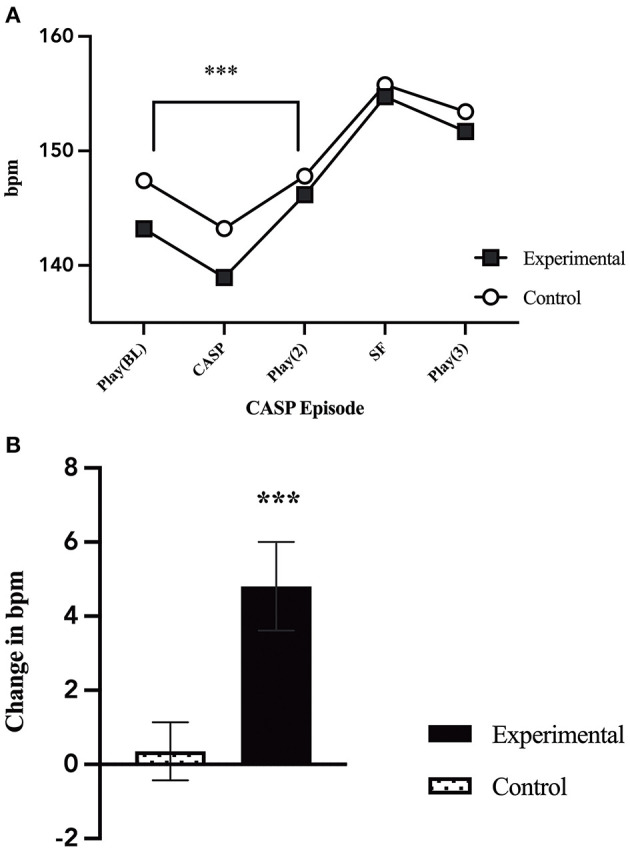
Changes in infant heart rate. (A) Infant average heart rate throughout the five CASP episodes by group. There was a significant increase in heart rate from play 1 (E1) to the second play (E3) for infant's who's mothers were in the caretaker-stress condition [F(1, 102) = 9.81, p = 0.002]. (B) Comparison of the change in infant average heart rate during play 1 (E1), before caretaker manipulation, and play 2 (E3), after the caretaker manipulation, by group (caretaker-stress or caretaker control condition) [F(1, 102) = 9.81, p = 0.002]. p < 0.01***.