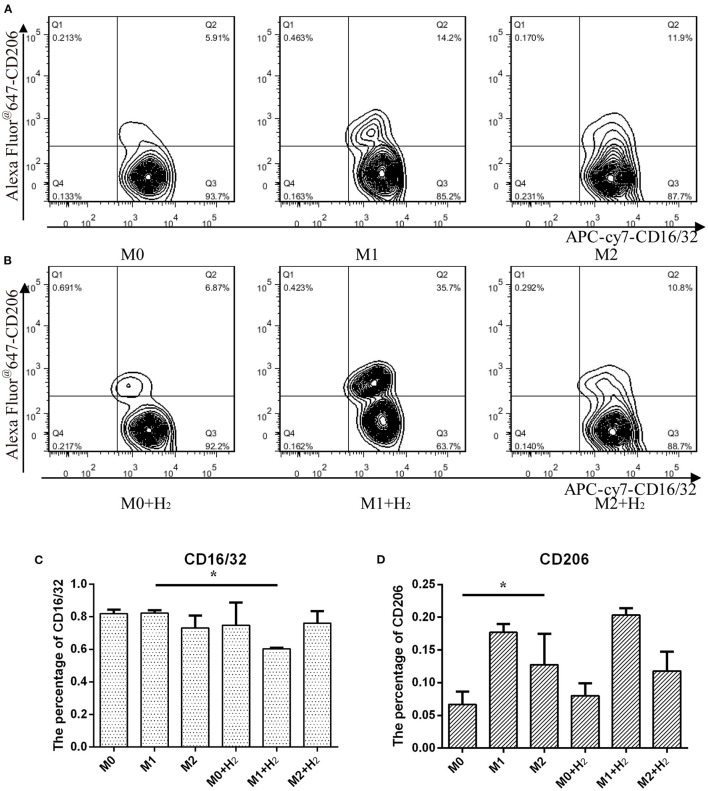
Figure 2.
Flow cytometry analysis of macrophages and their markers. Macrophages cultured in normal medium (A) and in hydrogen medium (B) with different additives, and quantification of CD16/32 (C) and CD206 (D) represented M1 and M2 macrophages from (A) and (B), respectively (*p < 0.05, **p < 0.01, ***p < 0.001).

