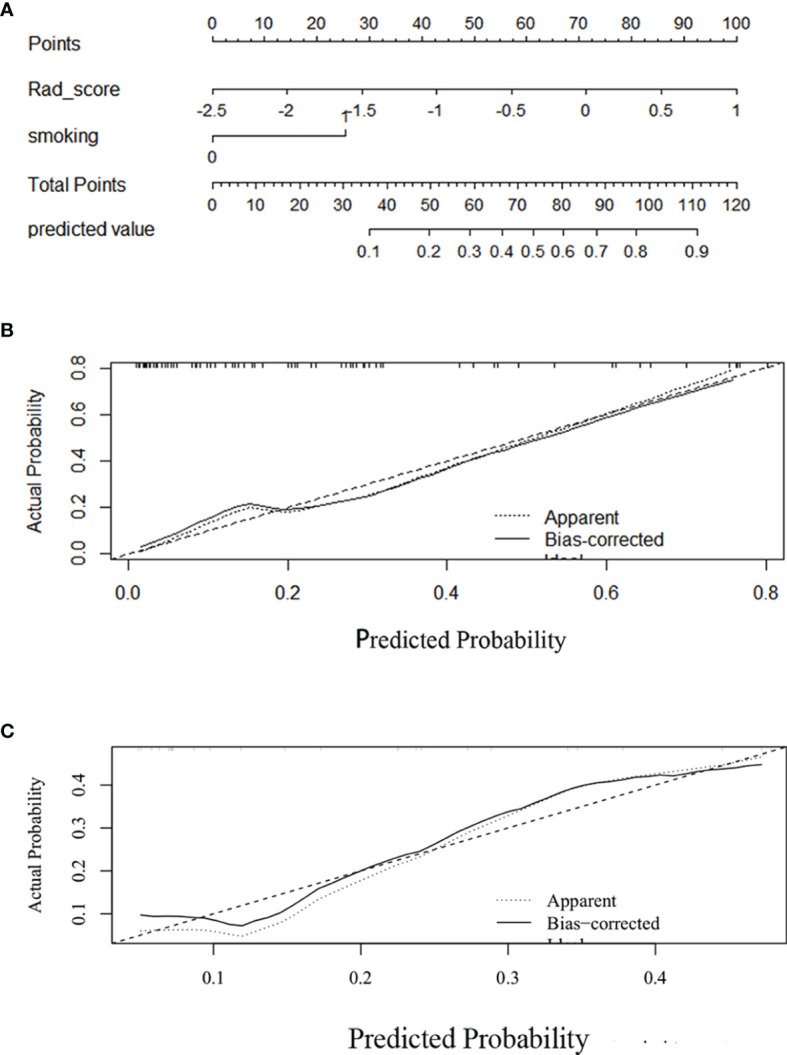
Figure 5.

Development and performance of a nomogram. (A) Nomogram based on rad-score and clinical factors (smoking history). Calibration curves (B, C) of the nomogram in the training set. The horizontal axis is the predicted incidence of the tumor microenvironment immune type (TMIT)-I tumors. The vertical axis is the observed incidence of the TMIT-I tumors. The diagonal line is the reference line, indicating that the predicted value is equal to the actual value. The prediction results and diagonals were basically coincident, indicating that the prediction results were accurate.
