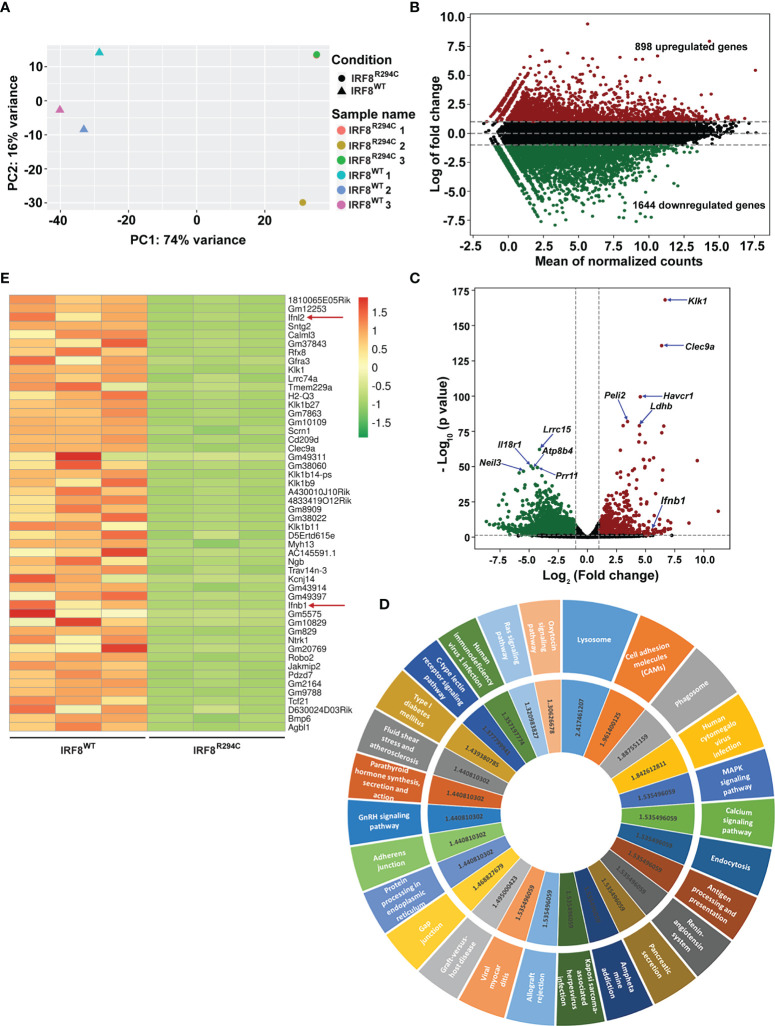
Figure 1.
Irf8R294C mutation leads to alteration in pDC transcriptome. (A) Plot showing principal component analysis of six samples; distance between the samples depicts the difference in gene expression among the two sets (IRF8R294C samples 1 and 3 are overlapping, hence appearing as a single dot). (B) MA plot presenting differential gene expression, indicating upregulated (in red) and downregulated (in green) genes in IRF8WT. (C) Volcano plot displaying the differential gene expression between the two groups of samples with upregulated and downregulated genes in IRF8WT illustrated in red and green, respectively. (D) KEGG pathway analysis of upregulated genes in IRF8WT; the outer circle represents top upregulated pathways, and the inner circle indicates corresponding –log10FDR value of respective KEGG pathway. (E) Heatmap depicting relative expression of top 50 genes across six samples with red and green color denoting upregulated and downregulated genes in IRF8WT, respectively.

