Figure 2.
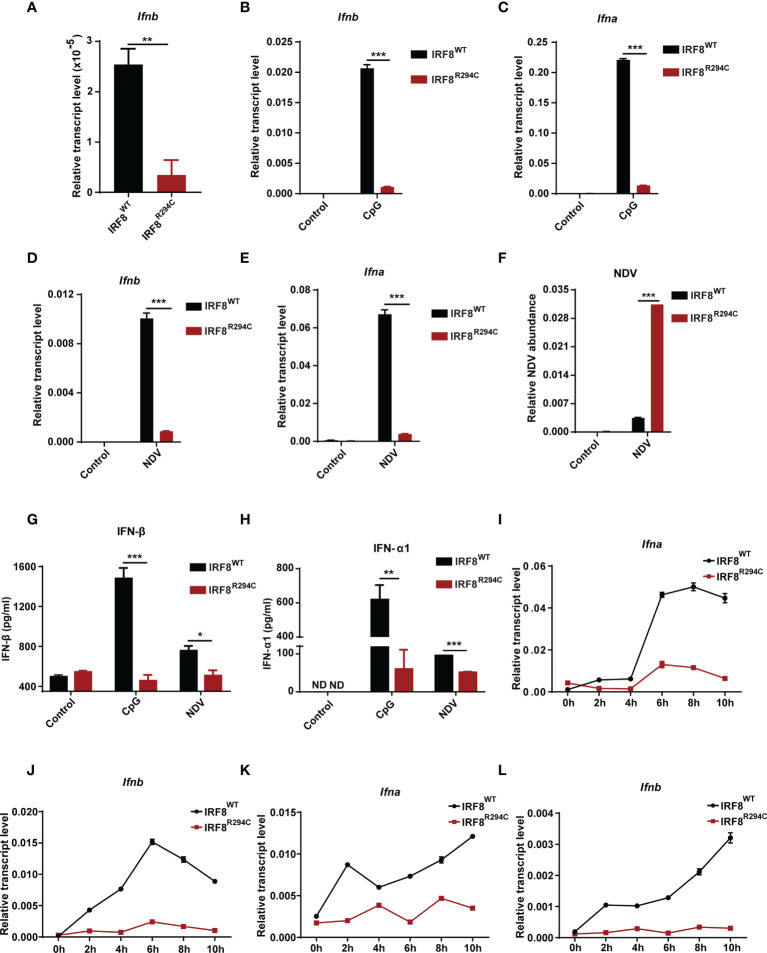
IRF8R294C pDCs show abrogation of type I IFN production in vitro. (A) RNA was isolated from IRF8WT and IRF8R294C FLDCs and analyzed by qRT-PCR to measure Ifnb expression. FLDC cultures from IRF8WT and IRF8R294C mice were stimulated with CpG (1 μg/ml) for 8 h, and level of Ifnb (B) and Ifna (C) transcript expression was checked by qRT-PCR. FLDC cultures from IRF8WT and IRF8R294C mice infected with NDV for 8 h were checked for expression of Ifnb (D), Ifna (E) transcripts, and NDV abundance (F) by qRT-PCR. FLDC culture supernatants from IRF8WT and IRF8R294C mice stimulated with CpG or infected with NDV for 24 h were examined for expression of IFN-β (G), IFN-α1 (H) cytokine by ELISA. FLDC cultures from IRF8WT and IRF8R294C mice stimulated with CpG (1 μg/ml) for indicated time points were analyzed for Ifna (I) and Ifnb (J) transcripts by qRT-PCR. FLDC cultures from IRF8WT and IRF8R294C mice infected with NDV for indicated time points were analyzed for Ifna (K) and Ifnb (L) transcripts by qRT-PCR. Data (A–F) are representative of three independent experiments with error bar representing + standard error of mean (SEM). Data (G, H) are mean of three independent experiments with error bar representing + standard error of mean (SEM). Data (I–L) are representative of three independent experiments with error bar representing ± standard error of mean (SEM). ND, not detected; *p < 0.05, **p < 0.01, ***p < 0.001; p value obtained from Student’s t test.

