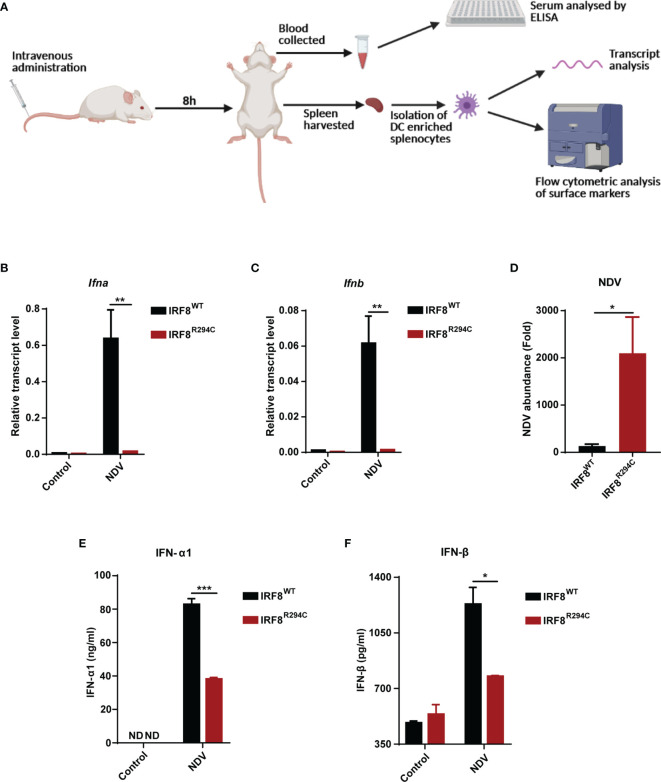
Figure 6.
Impairment of type I IFN production in IRF8R294C mice upon NDV infection. (A) Schematic representation of the workflow for in vivo NDV infection. Transcript analysis of Ifna (B), Ifnb (C), and abundance of NDV (D) in splenocytes from uninfected or NDV-infected IRF8WT and IRF8R294C mice by qRT-PCR. IFN-α1 (E) and IFN-β (F) concentration in sera from uninfected or NDV-infected IRF8WT and IRF8R294C mice were quantitated by ELISA. Data (B–D) shown are mean value with error bar representing + SEM (n= 6 mice per group). Data (E, F) shown are mean value with error bar representing + SEM (n= 3 mice per group) and *p < 0.05, **p < 0.01, ***p < 0.001; p value obtained from Student’s t test.

