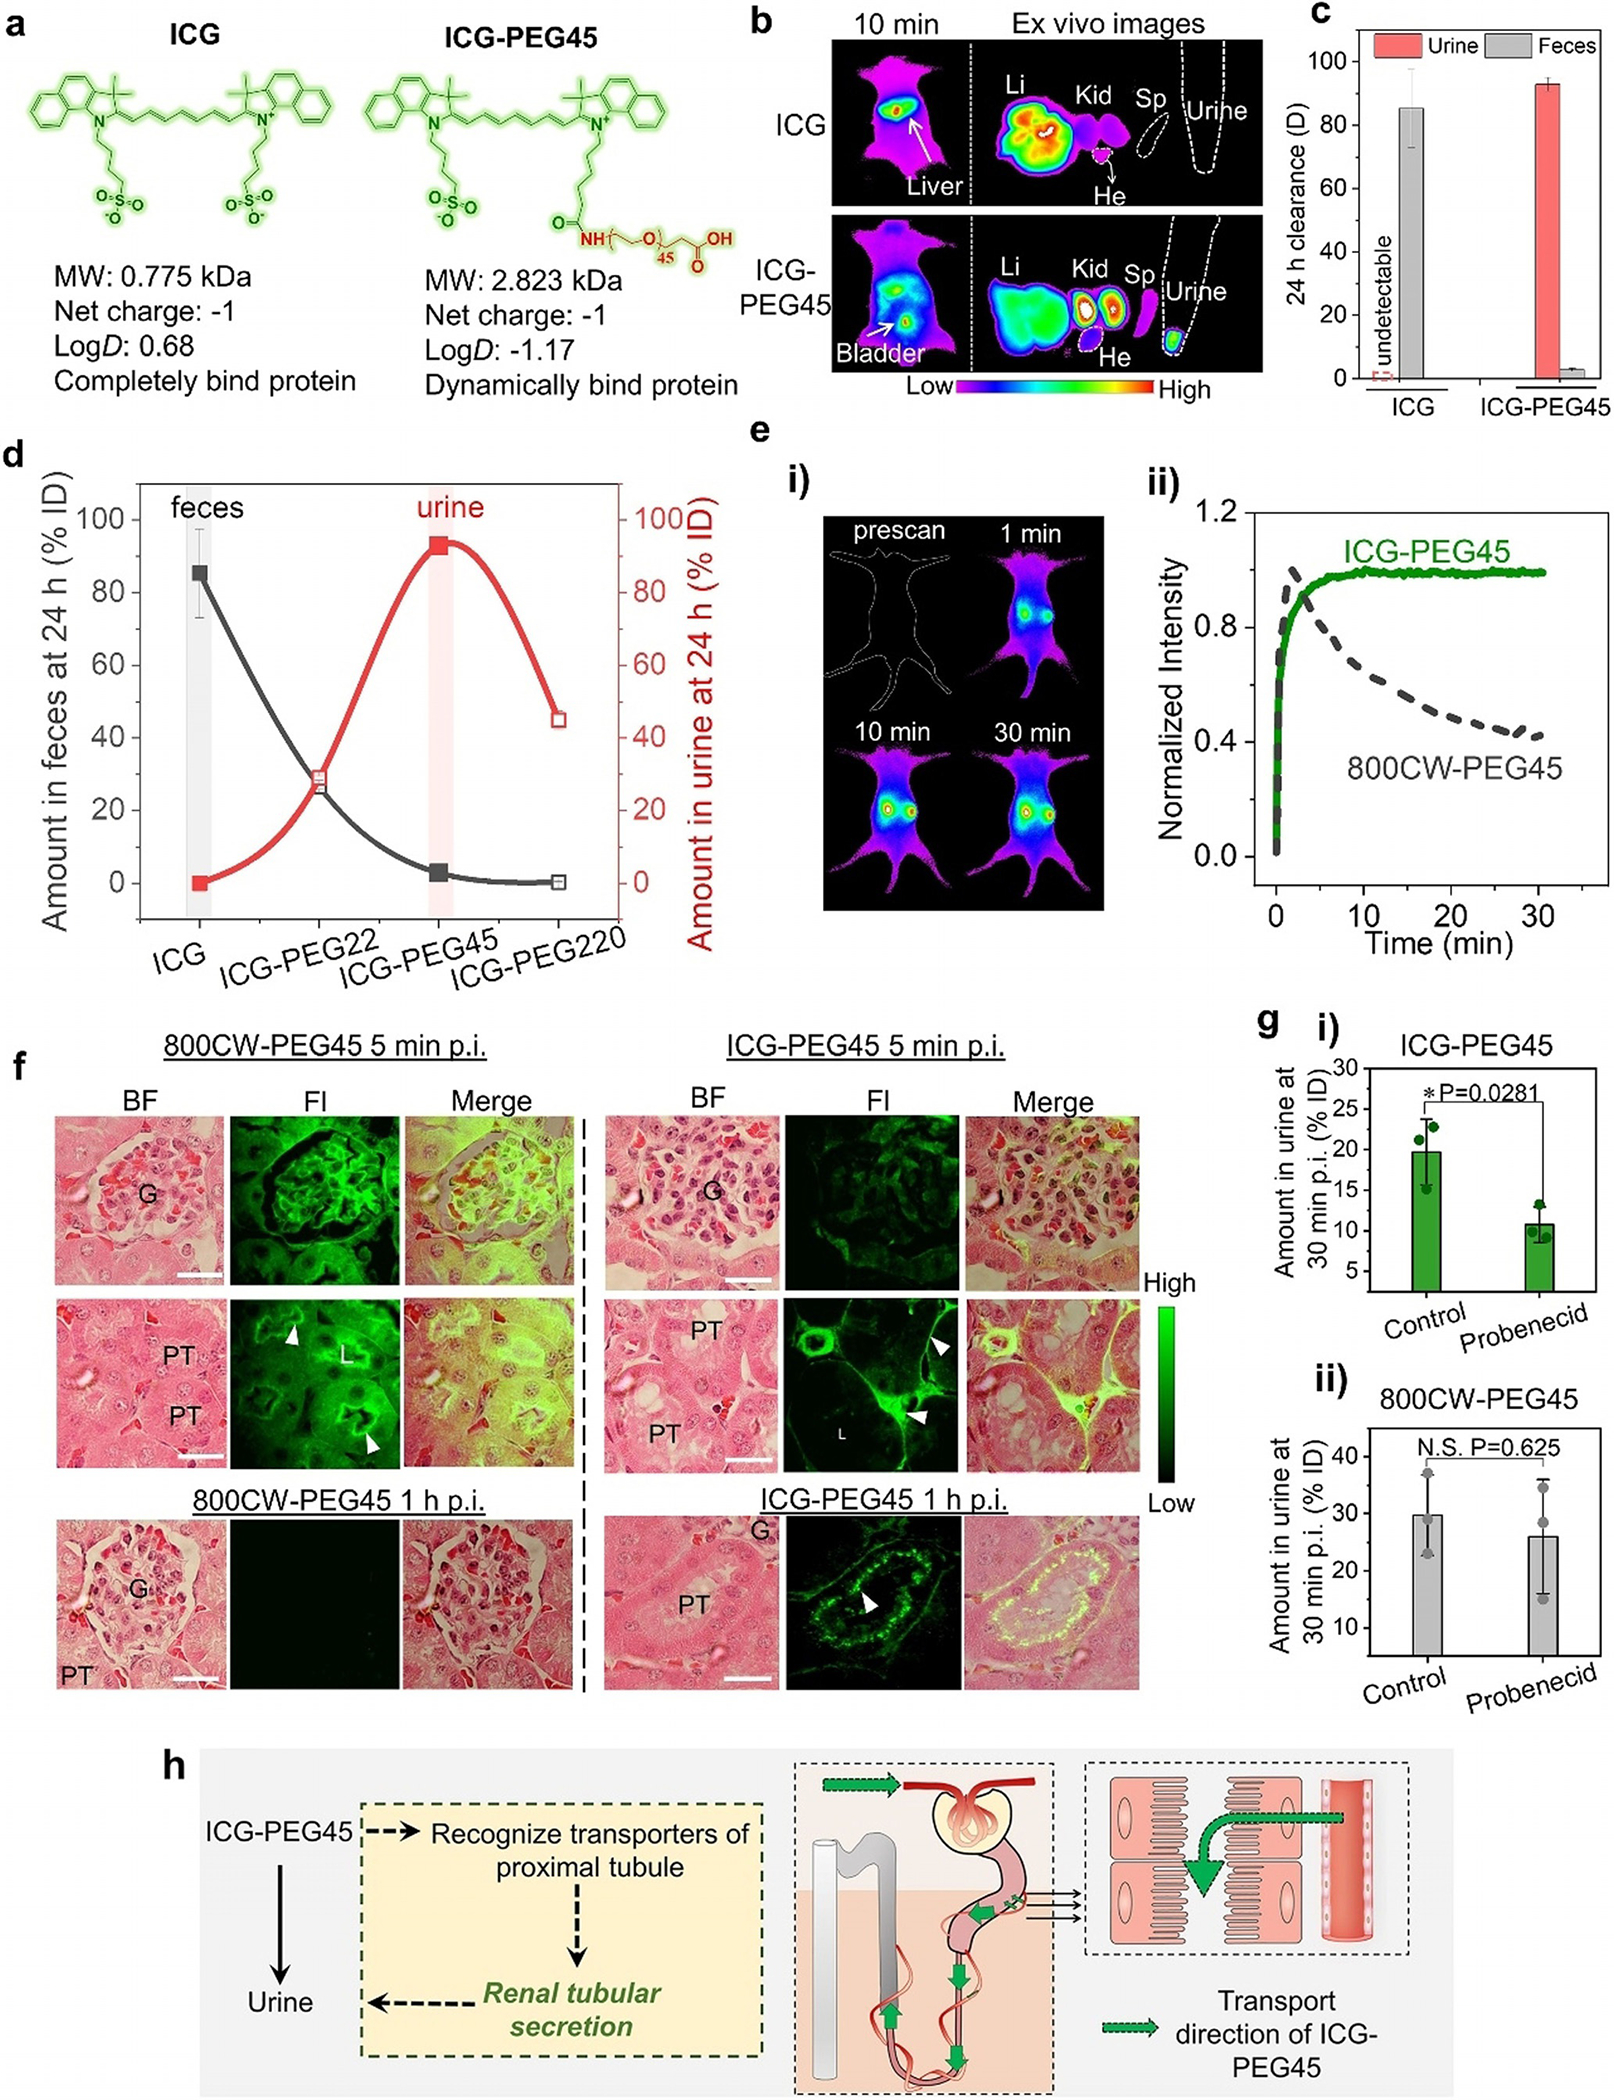
Figure 1.

PEG45 switches the clearance pathway of ICG from hepatobiliary clearance to renal tubular secretion. a) Comparison between ICG and ICG-PEG45 in chemical structures, molecular weight (MW), net charge, partition coefficient (logD), and serum protein binding. b) In vivo imaging of mice intravenously injection of ICG and ICG-PEG45 at 10 min post injection and ex vivo images of harvested liver (Li), kidneys (Kid), heart (He), spleen (Sp) and urine collected from bladder at 10 min post intravenous injections (Ex/Em filters: 790/830 nm). The mice were placed in prone position to collect signals from the liver. c) Clearance percentage of ICG and ICG-PEG45 in urine and feces, respectively, at 24 h post intravenous injection. d) Clearance percentage of ICG, ICG-PEG22, ICG-PEG45 and ICG-PEG220 in feces and urine at 24 h post injections. n=3. PEG45 behaved as a turning point in terms of renal clearance of ICG-PEGn. e) Real-time noninvasive kidney imaging before and after intravenous of injection of ICG-PEG45 (Ex/Em filters: 790/830 nm; i) and time-fluorescence intensity curves of two kidneys within 30 min post injection of ICG-PEG45 (ii). To make a comparison, the fluorescent kidney kinetics curve of 800CW-PEG45 was presented in the dotted line. To collect the signals of the kidneys, the mouse was placed in supine position on the imaging stage. f) Fluorescence images of glomerulus and tubules at tissue level at 5 min and 1 h post injection of 800CW-PEG45 and ICG-PEG45. G, glomerulus, PT, proximal tubule. Kidney tissue was stained by Hematoxylin and Eosin (H&E). Fluorescence images were taken at 775/845 nm for ICG-PEG45 and 720/790 nm for 800CW-PEG45. Scalar bar is 20 μm. g) The renal clearance efficiencies of ICG-PEG45 (i) and 800CW-PEG45 (ii) at 30 min post injection under control condition and probenecid-treated condition. n=3. *represents statistically different based on student t-test, P<0.05. N.S. represents no significant difference based on student-test, P>0.05. h) The schematic diagrams of the clearance alteration of ICG after conjugation of PEG45.
