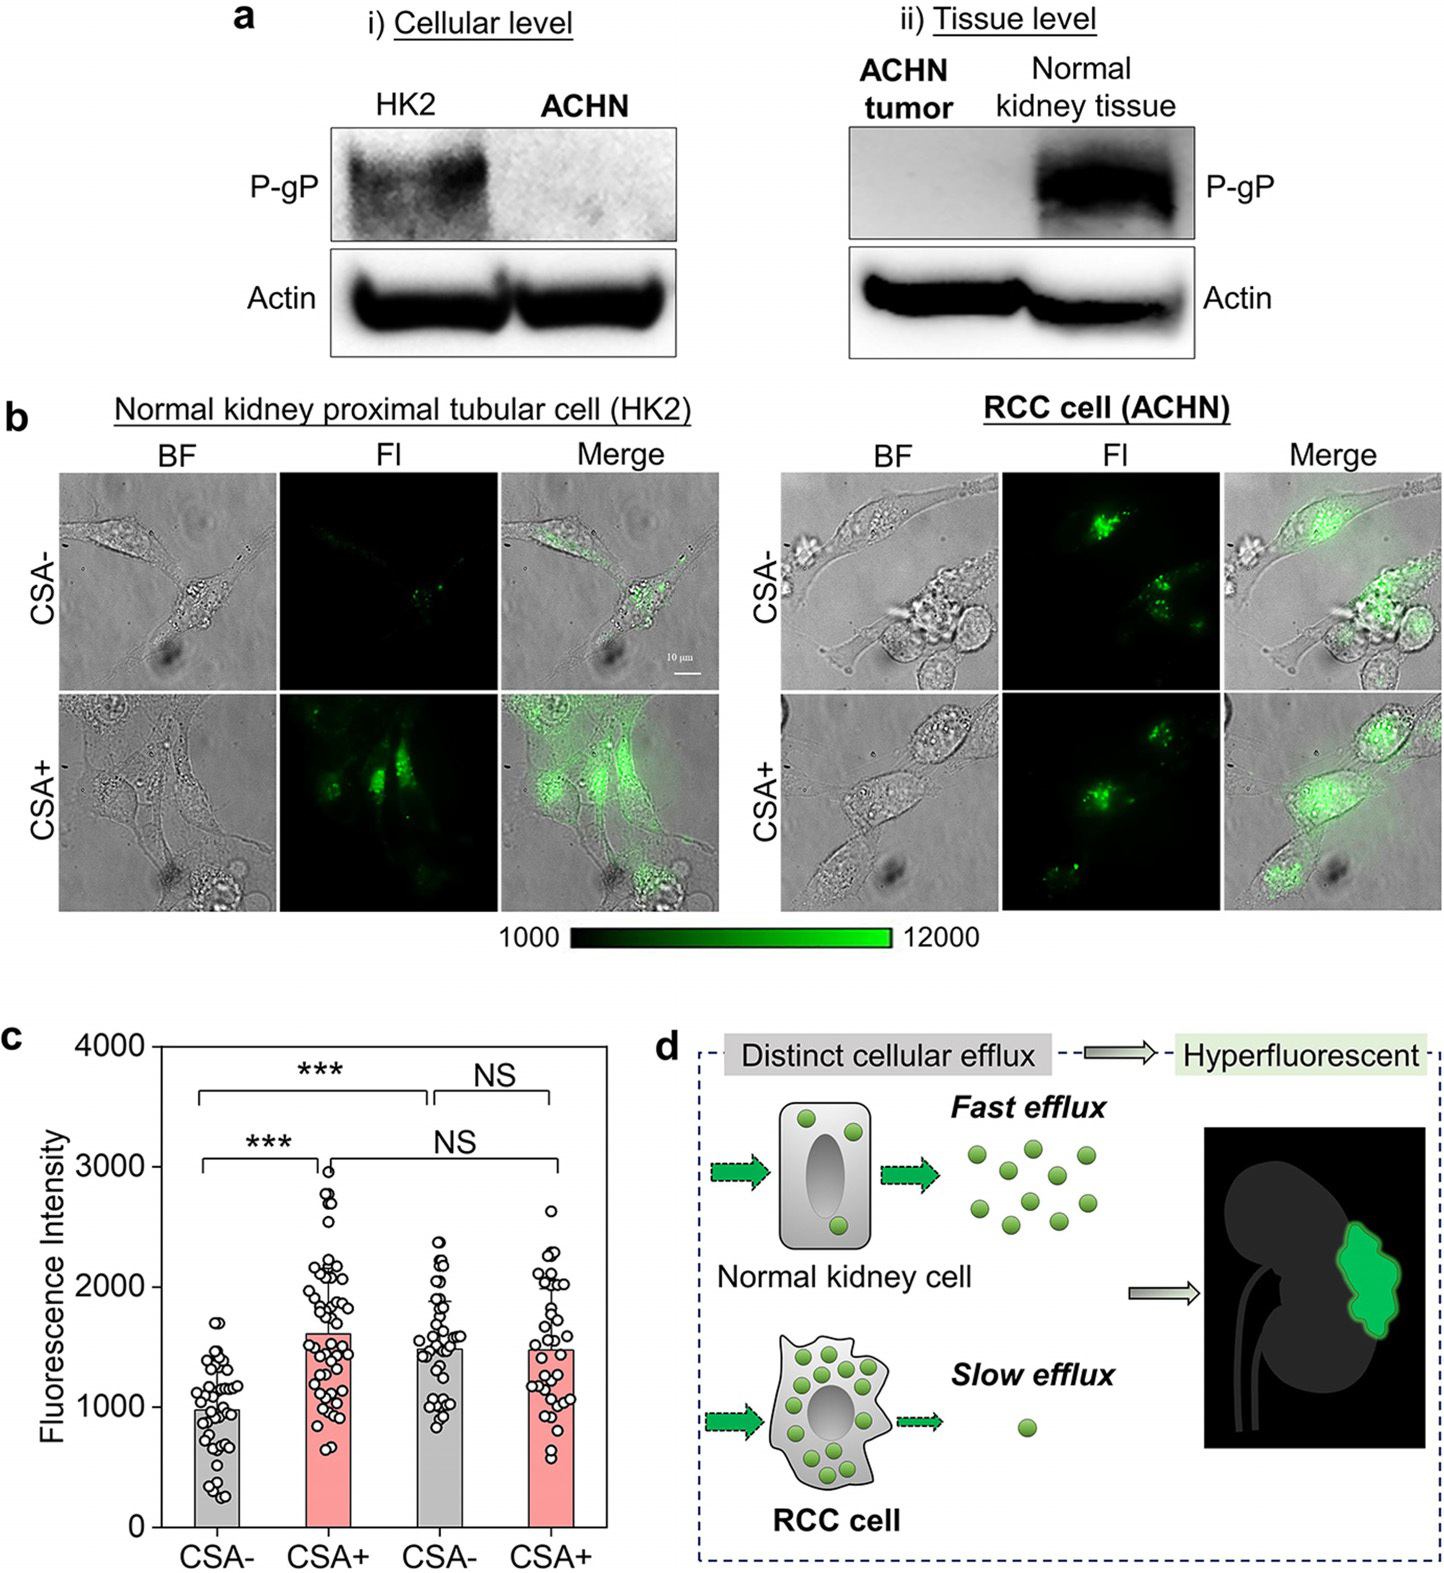
Figure 3.

Distinct efflux transport kinetics of ICG-PEG45 in normal and cancerous kidney cells. a) The P-glycoprotein (P-gP) expression level on the membrane of normal kidney proximal tubular cell (HK2) and renal cell carcinoma cell (ACHN) as well as at the tissue level. Actin was used as internal loading control. b) The cellular uptake fluorescence imaging of ICG-PEG45 in HK2 and ACHN before (CSA−) and after (CSA+) inhibition of P-gP-mediated efflux by the cyclosporin A (CSA) treatment. scalar bar is 10 mm. BF, bright field. Fl, fluorescence. c) The quantification of intracellular fluorescence intensity of ICG-PEG45. *** represents statistically different based on student t-test and P<0.0005. N.S. represents no significant difference based on student-test, P>0.05. d) The schematic diagrams of distinct cellular efflux of ICG-PEG45 in normal kidney proximal tubular cell and RCC cell, which is the origin of RCC hyperfluorescent contrast by ICG-PEG45.
