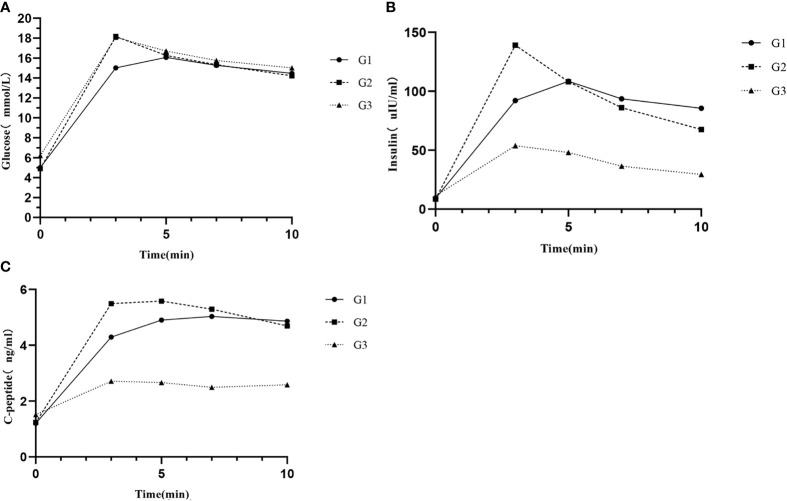
Figure 1.
(A) Glucose responses, (B) insulin responses, and (C) C-peptide responses during IVGTT among different groups. G1, subjects with normal glucose tolerance (NGT) and time to glucose peak after 3 min; G2, subjects with NGT and time to glucose peak at 3 min; and G3, subjects with prediabetes or diabetes mellitus and time to glucose peak at 3 min.

