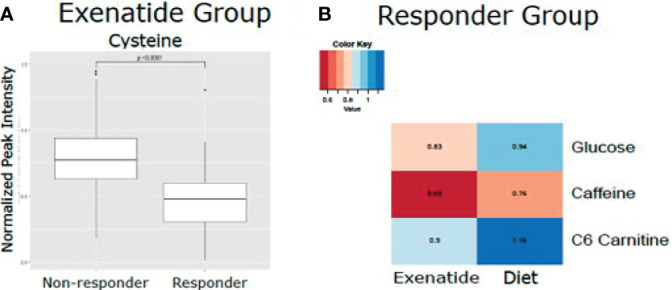
Figure 4.

(A) Mean normalized LC-MS peak intensity for cysteine, the only metabolite that was statistically different based on Wilcoxon Rank Sum test, between non-responder and responders in the Exenatide treated group. (B) Heatmap depicting the differences in metabolite levels, as measured by LC-MS peak intensity, that were statistically different (p<0.05) by Wilcoxon Rank Sum test between responders in the Exenatide and Diet treated groups.
