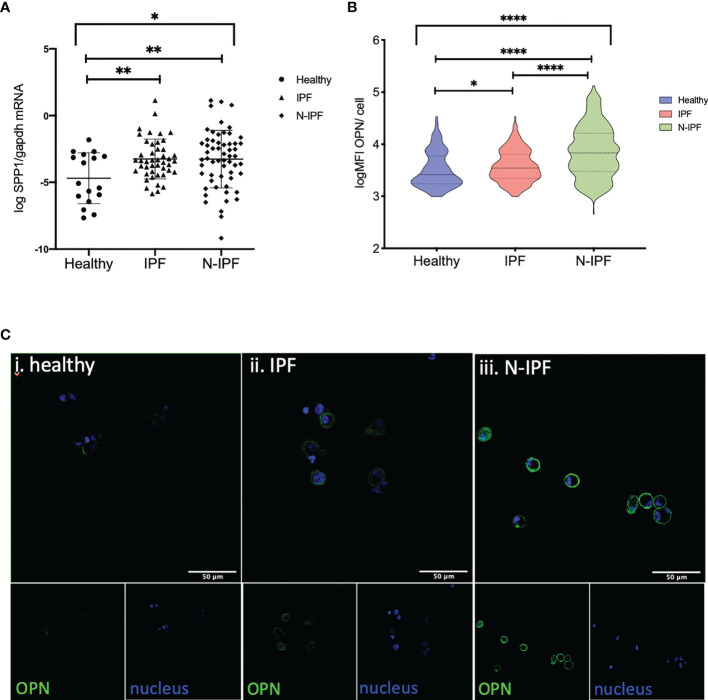
Figure 4.
SPP1 and OPN expression in BAL cells. (A) SSP1 relative mRNA levels in IPF and N-IPF relative to healthy (Brown-Forsythe Anova, with individual comparisons), (B) Violin plots of mean OPN expression/cell per disease group (Kruskal-Wallis test and individual comparisons) and (C) Typical Images of BAL cytospins stained with anti-human OPN antibody and ToPro-633 nuclear stain in (i) healthy, (ii) IPF and (iii) N-IPF samples (*p < 0.05, **P < 0.01, ****p < 0.0001).

