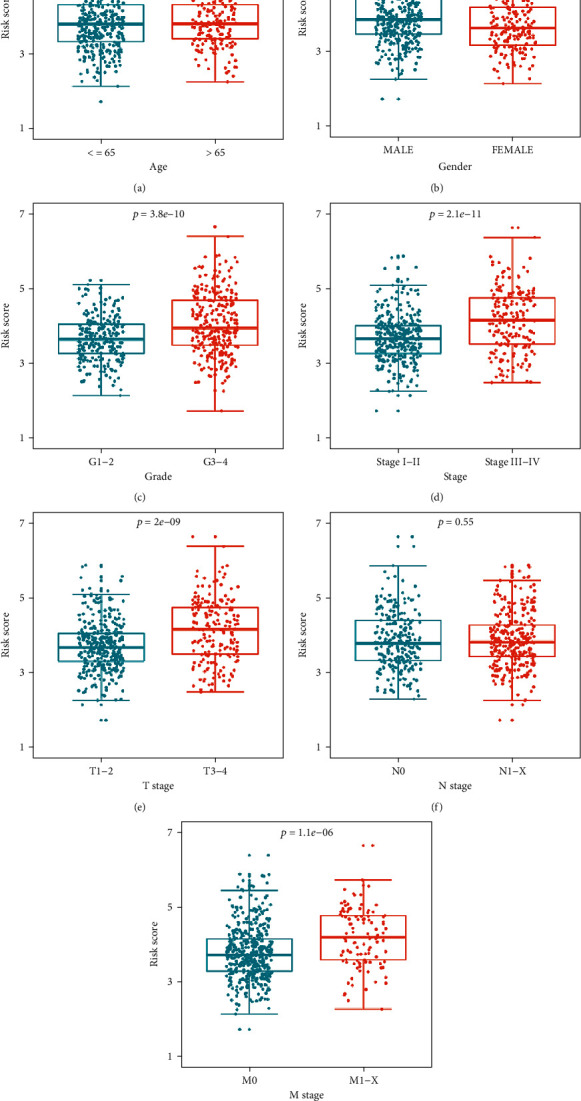
Figure 6.

Distribution of the prognostic risk score under stratification of different clinical variables. (a) Age; (b) gender; (c) grade; (d) stage; (e) T stage; (f) N stage; (g) M stage. (Subgraphs (a), (b), (e), (f), and (g) were the t-test with only one test; subgraphs (c) and (d) were the nonparametric Mann–Whitney rank sum test with only one test. The reported P value was the fdr value).
