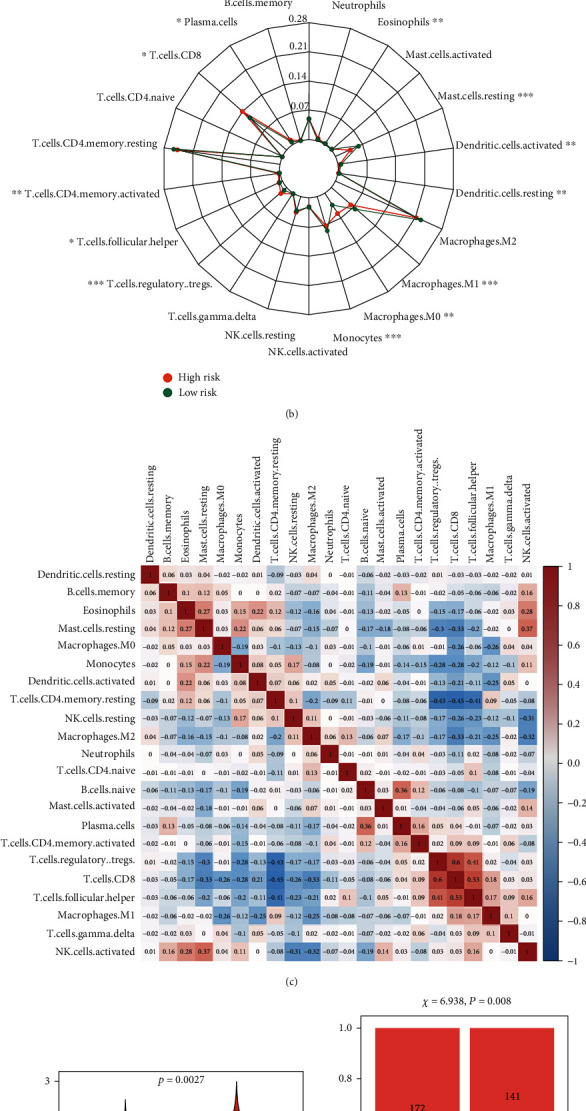
Figure 9.

Assessment of immune cell infiltration and immunotherapy. (a) Stacked bar chart of the distribution of 22 immune cells in each ccRCC sample in the TCGA cohort; (b) radar plot of immune cell infiltration grouped by the median risk score in the TCGA cohort; (c) proportional correlation matrix of immune cell; (d) TIDE prediction score grouped by the median risk score in the TCGA cohort; (e) immunotherapeutic responses grouped by median risk score in the TCGA cohort. (The statistical method was t-test; the reported P value was the fdr value).
