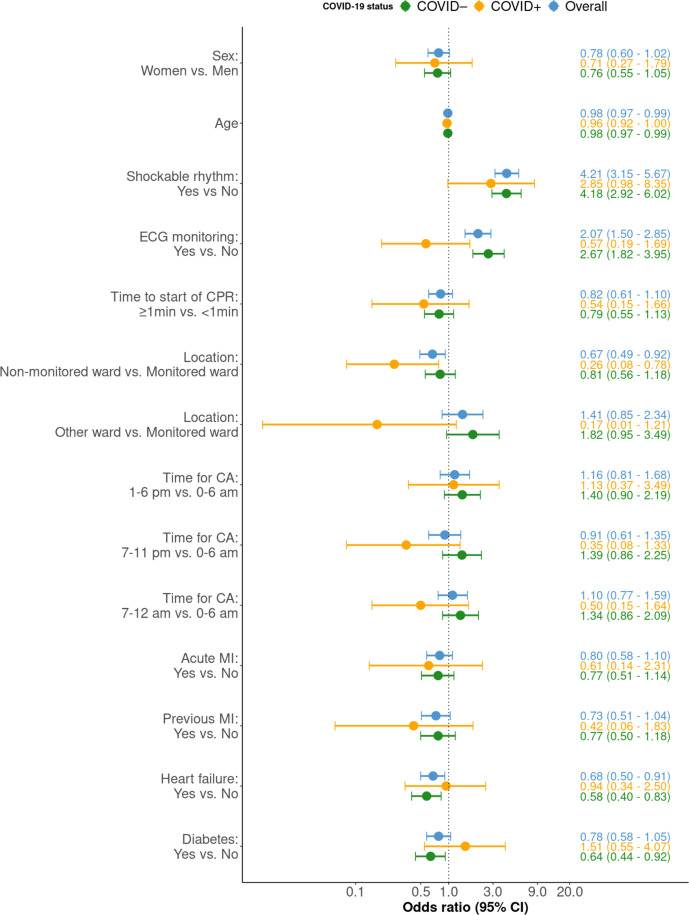
Figure 4.
OR for 30-day survival. Forest plot with OR for 30-day survival, stratified on the groups, no infection, ongoing infection and overall, all in different colours. The 95% CI is shown between the bars. X-axis has a logarithmic scale. CA, cardiac arrest; CPR, cardiopulmonary resuscitation; MI, myocardial infarction.

