Figure 1.

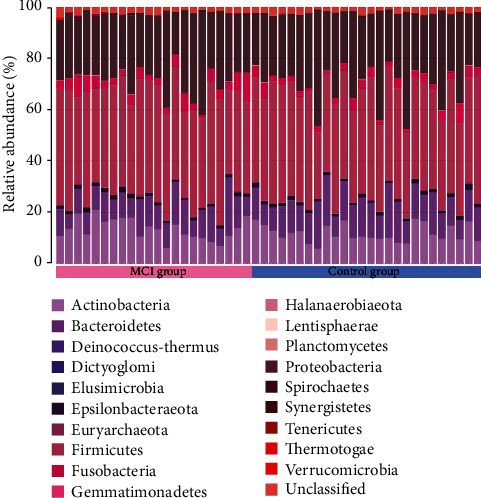
Gut microbiota composition. Proportion of the different phyla (represented by different colors) detected in the two groups.

Gut microbiota composition. Proportion of the different phyla (represented by different colors) detected in the two groups.