. 2021 Nov 16;10:e59912. doi: 10.7554/eLife.59912

Figure 2. MT instability increases β-cell activation and insulin secretion.

(A) Example images of a single secretion event pre-processing. Secretion signal starts at 65 ms and dissipates out. (A’) Graph of the average intensities of a circular ROI from images in panel (A). (B–D) Time projections of islets from Figure 2—videos 1–3 inverted. Fluozin-3 flashes are represented as black areas. Cell borders identified via pre-assay imaging (see Materials and methods) overlaid in red. Islets were preincubated in DMSO (control, B), nocodazole (C), or taxol (D) and stimulated with 20 mM glucose. Scale bars: 100 µm. (E) Graph of the percentage of cells in each field of view with at least one secretion event. Red bars, mean. One-way ANOVA and multiple comparison tests, p-value as indicated. N=16–19 islets. Here and below, islets derived from three or more independent isolations per each condition. (F) Glucose-stimulated secretion as detected by FluoZin-3 assay in islets. A representative output image from Matlab script (see Materials and methods) shows cell outlines (black lines) and secretion events (dots). Black dots are non-clustered secretion events, colored dots are clustered secretion events. (G) The same islet as in (F) fixed after the assay and stained for Glu-tubulin (grayscale). Cell outlines within which Glu-tubulin intensity was measured are shown in red. Numbers correspond to cells in (F) with the same number. The outline ‘bkg’ indicates background measurement area. Maximum intensity projection over 1.2 µm at the bottom of the islet. Bar: 10 µm. (H) Correlative analysis between data as in (F) and (G). The number of secretion events per cell with Glu-tubulin intensity below islet average and those above islet average is compared in the graph. Mann-Whitney nonparametric comparison test p-value is shown. N=98 cells from five islets. The same data set as in Figure 2—figure supplement 2A. (I) Graph of secretion events per cell detected by FluoZin-3 assay. All cells in a field of view are analyzed, whether activated during the movie or not. Red bar, mean. Kruskal-Wallis test nonparametric and multiple comparison tests, p-value as indicated, N=495–637 cells from 16 to 19 islets. (I’) Cells from panel (H), graphed as a stacked histogram of the percentage of total cells per condition that had each number of secretion events. (J) Graph of secretion events per cell only including cells with at least one event during the duration of the movie. Red bar, mean. Kruskal-Wallis test nonparametric and multiple comparison tests, p-value as indicated, N=88–407 cells from 16 to 19 islets. (J’) Cells from panel (I), graphed as a stacked histogram of the percentage of cells that had each number of secretion events. MT, microtubule; ROI, region of interest.

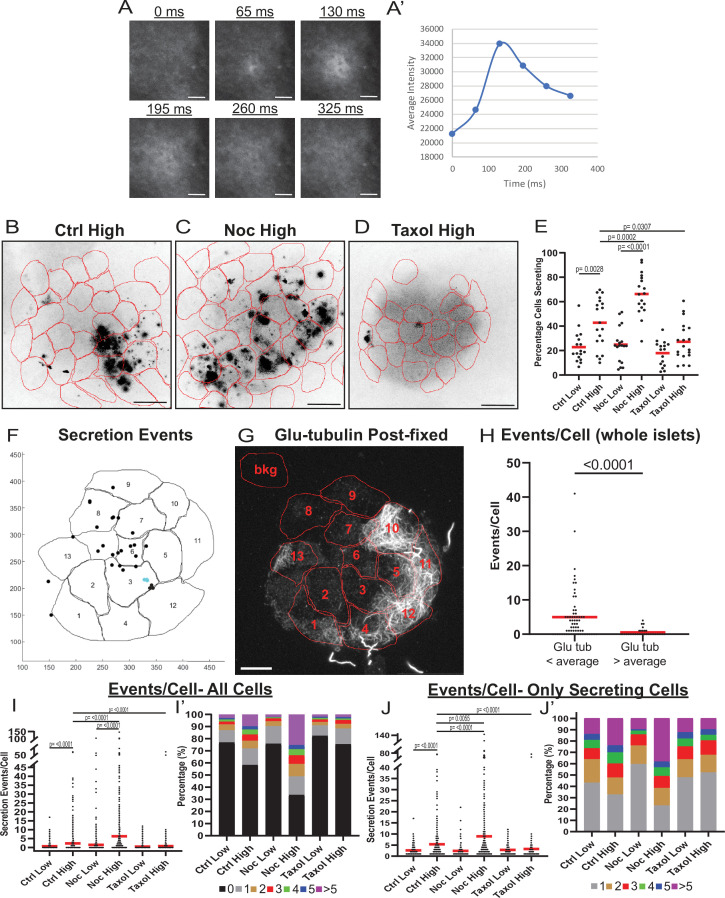
Figure 2—source data 1. Data for graphs depicted in Figure 2E, H,I,I',J,J' and Figure 2—figure supplement 2A, B, C.
Each data set is a separate sheet.
Figure 2—source data 2. Matlab script to identify secretion events and clusters.
Script is annotated.
Figure 2—source data 3. Matlab script to identify secretion events and clusters for correlative microscopy.
Script is annotated.

Figure 2.

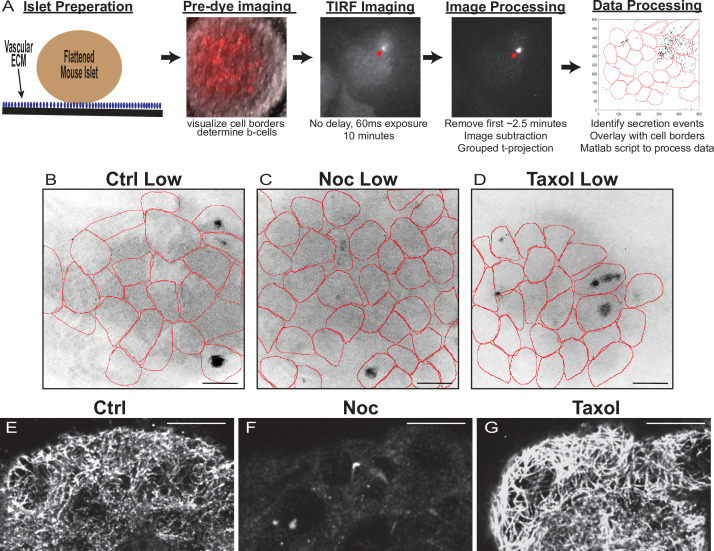
Figure 2—figure supplement 1. Assay protocol and basal glucose conditions are not affected by MT stability.

Figure 2—figure supplement 1.

(A) Overview of Fluozin-3 assays. For more information, see Materials and methods. (B–D) Time projections of islets from Figure 2—videos 1–3 inverted. Fluozin-3 flashes are represented as black areas. Cell borders overlaid in red. Islets were preincubated in DMSO (control, B), nocodazole (C), or taxol (D) and incubated in 2.8 mM glucose. Scale bars: 100 µm. (E–G) Representative images of tubulin following Fluozin-3 imaging as shown in (A). Islets were preincubated in DMSO (control, E), nocodazole (F), or taxol (G) and stimulated with 20 mM glucose. Three-image max projection of the bottom of the islet. Scale bars: 10 µm. MT, microtubule.
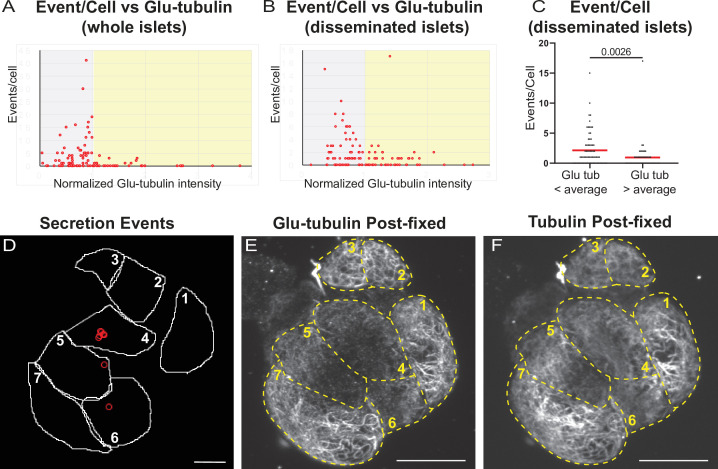
Figure 2—figure supplement 2. Correlation of insulin secretion and MT stability.

Figure 2—figure supplement 2.

(A) Correlation of Glu-tubulin intensity (normalized to islet average) to the number of secretion events per cell in whole islets. Gray field, intensity below islet average (<1). Yellow field, intensityabove islet average (>1). The same data set as in Figure 2F–H. (B) Correlation of Glu-tubulin intensity (normalized to the field of view average) to the number of secretion events per cell in disseminated islets. Correlative analysis between data as in (D) and (E). Gray field, intensity below field average (<1). Yellow field, intensity above field average (>1). (C). The number of secretion events per cell in disseminated islets with Glu-tubulin intensity below field average and those above field average is compared in the graph. The same data set as in (B). Mann-Whitney nonparametric comparison test p-value is shown. N=124 cells. (D) Cell outlines (white line) and secretion events (red circles) from a disseminated islet after 10 min in 20 mM glucose and Fluozin-3 dye. Scale bars: 10 µm. (E, F) Disseminated islet from (E) post-fixed following TIRF imaging for Glu-tubulin (E) and tubulin (F). Cells (yellow dashed lines) correspond to cells in (E) with the same number. Single slice from the bottom of the cells. Scale bars: 10 µm. MT, microtubule; TIRF, Total internal reflection fluorescent.
Figure 2—video 1. Control islet insulin secretion in low and high glucose.
Download video file (62.6MB, mp4)
DMSO treated islets in low glucose (left) and high glucose (right). Five-frame projection through time, each slice is 325 ms over about 8.5 min. FluoZin-3 dye creates flashes upon zinc binding, representing a single insulin secretion event.
Figure 2—video 2. Nocodazole islet insulin secretion in low and high glucose.
Download video file (57.8MB, mp4)
Nocodazole treated islets in low glucose (left) and high glucose (right). Five frame projection through time, each slice is 325 ms over about 8.5 min. FluoZin-3 dye creates flashes upon zinc binding, representing a single insulin secretion event.
Figure 2—video 3. Taxol islet insulin secretion in low and high glucose.
Download video file (57.8MB, mp4)
Figure 2 Taxol treated islets in low glucose (left) and high glucose (right). Five frame projection through time, each slice is 325 ms over about 8.5 min. FluoZin-3 dye creates flashes upon zinc binding, representing a single insulin secretion event.