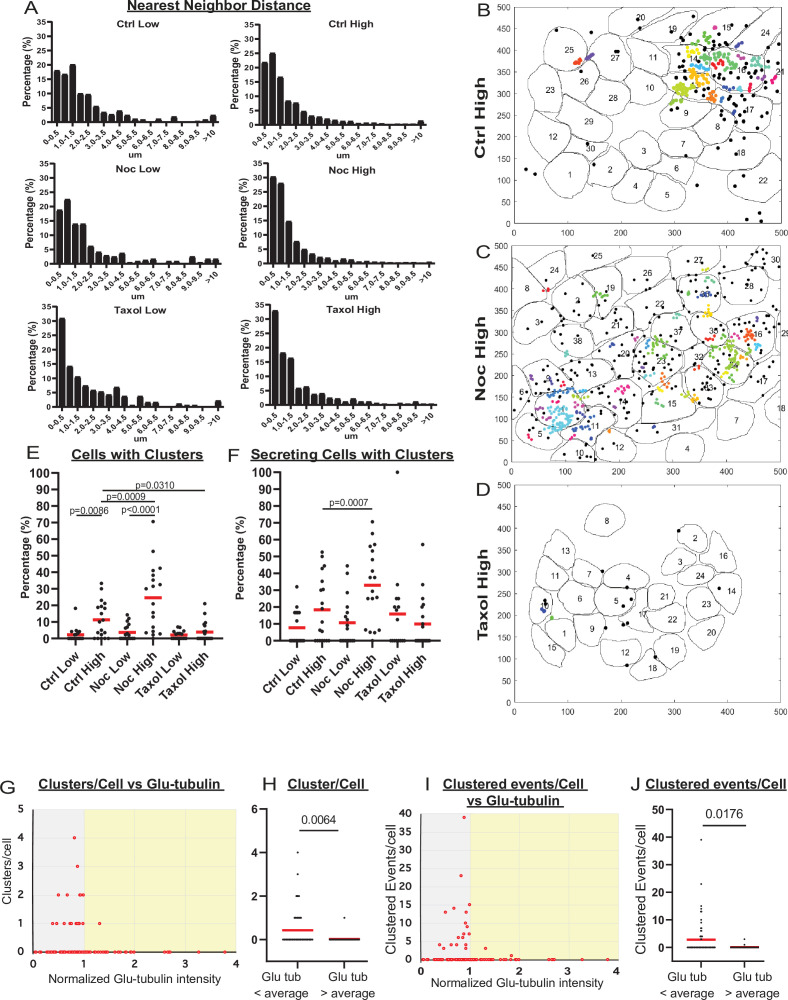
Figure 3. MT stability suppresses formation of insulin secretion hot spots.
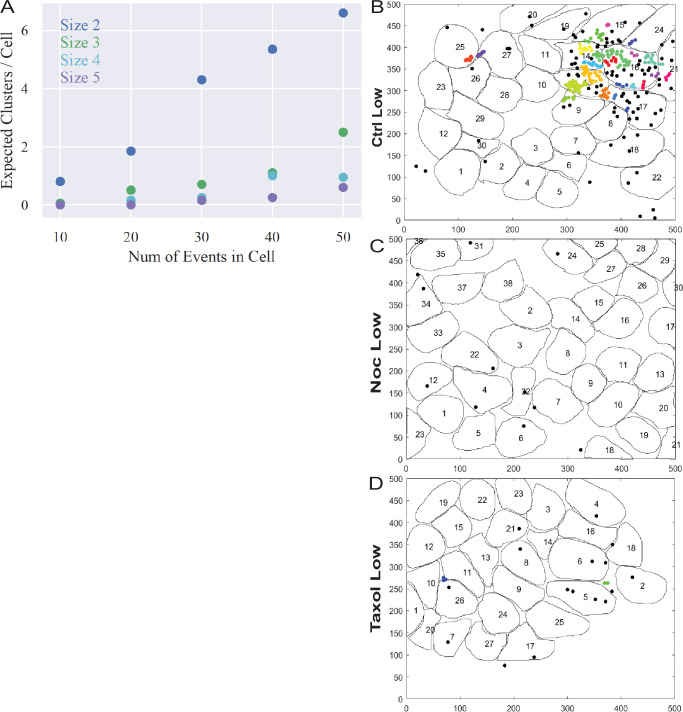
(A) Histogram of nearest neighbor distances obtained by measuring the distance between secretion events in cells with more than one secretion event during the movie. Graphed as the percentage of events within each bin per condition. Bin=0.5 µm. N=91–3255 distances from 16 to 19 islets. (B–D) Representative images of output from Matlab script (see Materials and methods) showing cell outlines (black lines) and secretion events (dots). Black dots are non-clustered secretion events, colored dots are clustered secretion events, each different color denotes a different cluster. Clusters were defined as 3+ secretion events occurring within nine pixels (1.44 µm) by density-based scanning. Islets were pre-treated with DMSO (control, B), nocodazole (C), or taxol (D) and were stimulated with 20 µm glucose. (E) Graph of the percentage of cells in each field of view with at least one cluster. Red bars, mean. One-way ANOVA and multiple comparison tests, p-value as indicated. N=16–19 islets. (F) Graph of the percentage of cells in each field of view with at least one cluster out of cells with at least one secretion event. Red bars, mean. One-way ANOVA and multiple comparison tests, p-value as indicated. N=16–19 islets. (G) Correlation of Glu-tubulin intensity (normalized to islet average) to the number of secretion clusters per cell in whole islets. Gray field, intensity below islet average (<1). Yellow field, intensity above islet average (>1). The same data set as in Figure 2F–H. (H) The number of clusters in cells with Glu-tubulin intensity below islet average and those above islet average is compared in the graph. Mann-Whitney nonparametric comparison test p-value is shown. N=98 cells from five islets. The same data set as in Figure 2F–H. (I) Correlation of Glu-tubulin intensity (normalized to islet average) to the number of clustered secretion events per cell in whole islets. Gray field, intensity below islet average (<1). Yellow field, intensity above islet average (>1). The same data set as in Figure 2F–H. (J) The number of clustered events in cells with Glu-tubulin intensity below islet average and those above islet average is compared in the graph. Mann-Whitney nonparametric comparison test p-value is shown. N=98 cells from five islets. The same data set as in Figure 2F–H. MT, microtubule.


