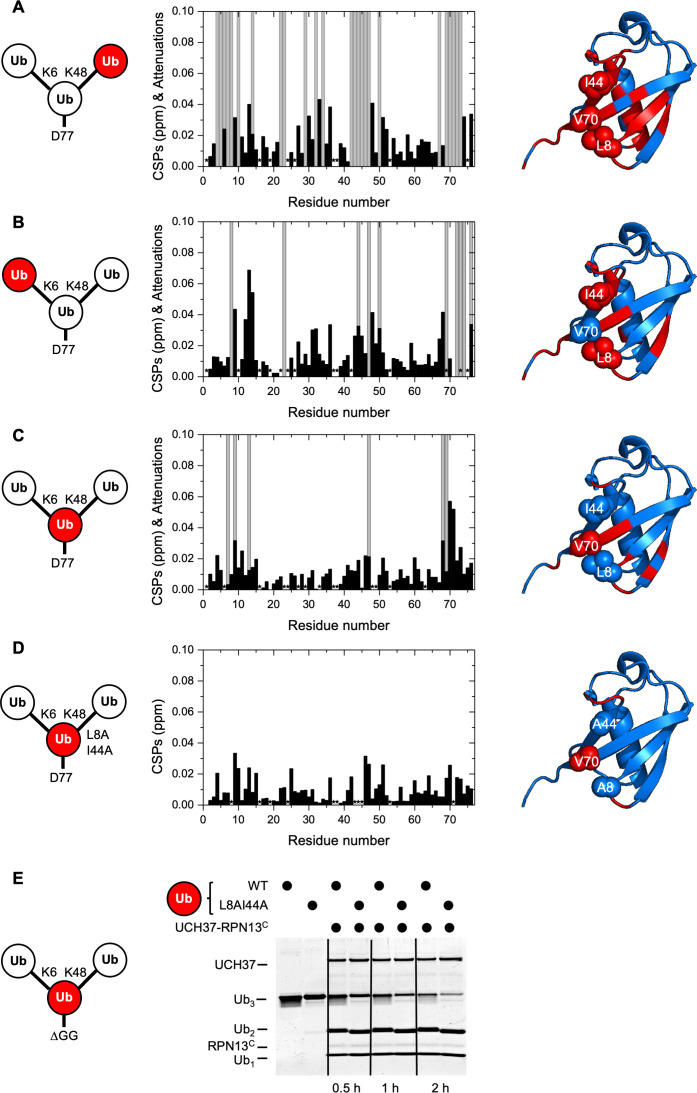
Figure 3. UCH37–RPN13C contacts the hydrophobic patches on both distal ubiquitin (Ub) units in a branched Ub3 chain.
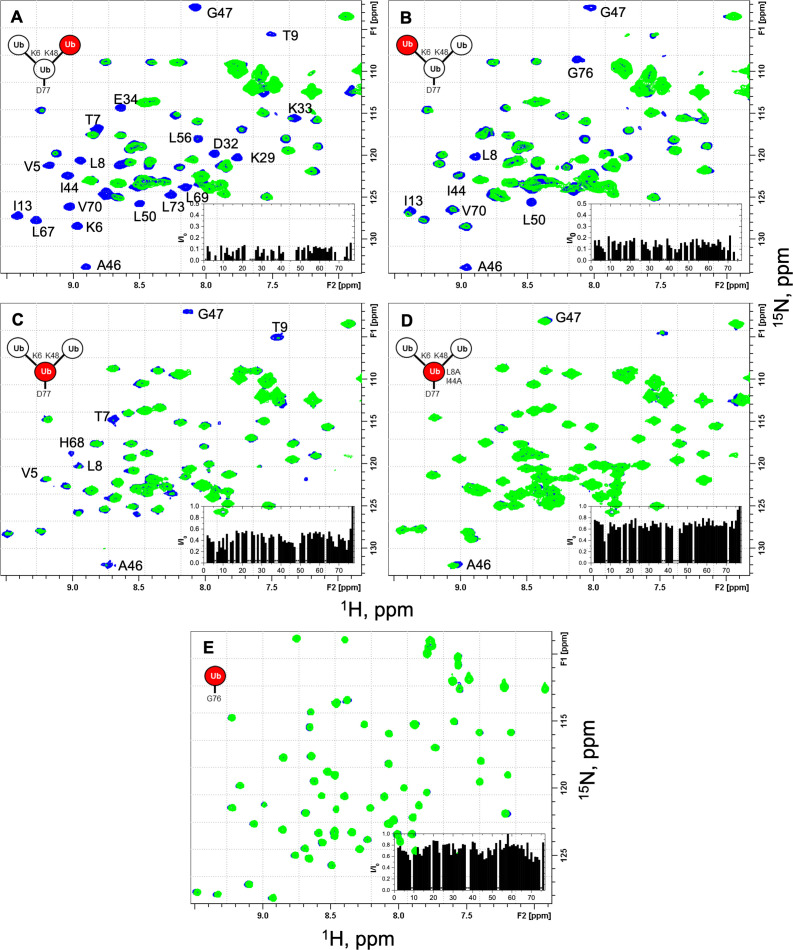
Residue-specific perturbations of backbone amide NMR signals in the (A) K48-linked distal Ub, (B) K6-linked distal Ub, (C) the proximal Ub, and (D) mutated proximal Ub(L8A,I44A) in branched K6/K48-linked Ub3 caused by the addition of 1.2 molar equivalents of copurified UCH37(C88A)–RPN13C. The NMR spectra are shown in Figure 3—figure supplement 1. Black bars represent chemical shift perturbations (CSPs, in ppm), gray bars mark residues exhibiting strong signal attenuations. Residues that were not observed or could not be unambiguously assigned/quantified due to signal overlap are marked with asterisks. Residues with strong signal attenuations or CSP >0.025 ppm are mapped (red) on the 3D structure of Ub (PDB code: 1UBQ); the hydrophobic patch residues are shown in sphere representation. (E) 1 µM UCH37–RPN13C was incubated with 5 µM substrate as indicated at 37 °C. Reaction products were analyzed by sodium dodecyl sulphate-polyacrylamide gel electrophoresis (SDS–PAGE) and Coomassie staining.


