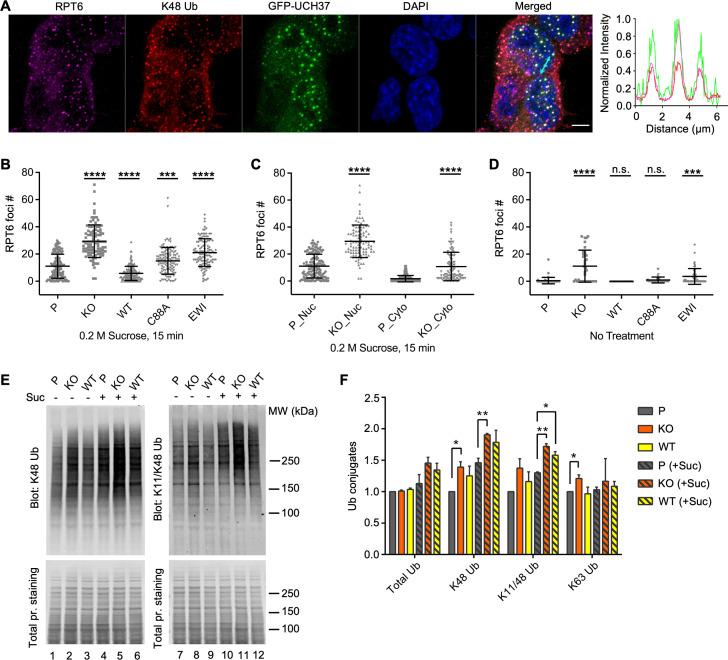
Figure 5. UCH37 activity regulates proteasome condensates upon osmotic stress.
(A) HCT116 cells expressing Flag-GFP-UCH37(C88A) were treated with 0.2 M sucrose for 15 min, then fixed and immunostained with RPT6 and K48-specific antibodies. The line profile represents the magenta (RPT6), red (K48), and green (GFP) channel intensities along the arrow shown in cyan (merged panel). Scale bar, 5 μm. (B–D) RPT6 foci numbers in each cell were quantified and are shown as mean ± standard deviation (SD); n > 100 cells were measured for each cell type. Unpaired t-tests were performed between each cell type and P: ***, p < 0.001; ****, p < 0.0001; n.s., not significant. (E) Whole-cell lysates were collected from P, KO, and WT cells with or without 30 min 0.2 M sucrose treatment, and then analyzed by sodium dodecyl sulphate-polyacrylamide gel electrophoresis (SDS–PAGE) and immunblotting with the indicated antibodies. (F) Quantification of Ub conjugates from whole-cell lysates immunoblotted with FK2 antibody (for total Ub conjugates) or with linkage-specific anti-Ub antibodies. Representative blots are shown in (E). Anti-Ub signals relative to those in P were plotted after normalization using the signal intensities from total protein stain. Mean ± SD from two independent replicates are plotted. Unpaired t-tests were performed between each cell type and P: *, p < 0.05; **, p < 0.01.


