. 2021 Nov 11;10:e72798. doi: 10.7554/eLife.72798

Figure 6. UCH37(C88A)-containing proteasomes accumulate polyUb species and RAD23B.

(A) Soluble cell lysates were collected from WT, C88A, and EWI cells with or without 30 min 0.2 M sucrose treatment, analyzed by sodium dodecyl sulphate-polyacrylamide gel electrophoresis (SDS–PAGE) and immunblotting with indicated antibodies. Numbers indicate Ub signals relative to those in untreated WT cells after normalization against total protein stain signals. (B) UCH37-containing proteasomes were immunoprecipitated and analyzed as described in (A). Numbers below the lanes indicate Ub signals relative to those in untreated WT cells after normalization against RPN2 signals. (C) Different types of Ub species associated with UCH37-containing proteasomes immunoprecipitated from HEK293 cells were quantified by a free Ub sensor-based assay (Choi et al., 2019). Shown are mean ± SD from two independent replicates. (D) RAD23B accumulation detected on UCH37(C88A)-containing proteasomes as described in (A) and (B). (E) Fluorescence recovery after photobleaching (FRAP) analysis of GFP-UCH37 after 0.2 M sucrose treatment demonstrates that C88A-containing proteasomes are less mobile. At least 20 foci from 7 or 8 cells were analyzed from each cell line. After fitting the FRAP curve with two exponentials, the slow t1/2 of each focus were plotted with mean and SD indicated. (F) UCH37-containing proteasomes from WT, C88S, and EWI cells were isolated with immobilized anti-GFP nanobodies, trypsin digested, and the peptides analyzed by tandem mass tag (TMT) mass spectrometry. Protein abundances were measured from two independent pulldowns, each analyzed by mass spectrometry in triplicate, and plotted as mean ± coefficient of variation (CV) after normalizing against signals from WT samples.

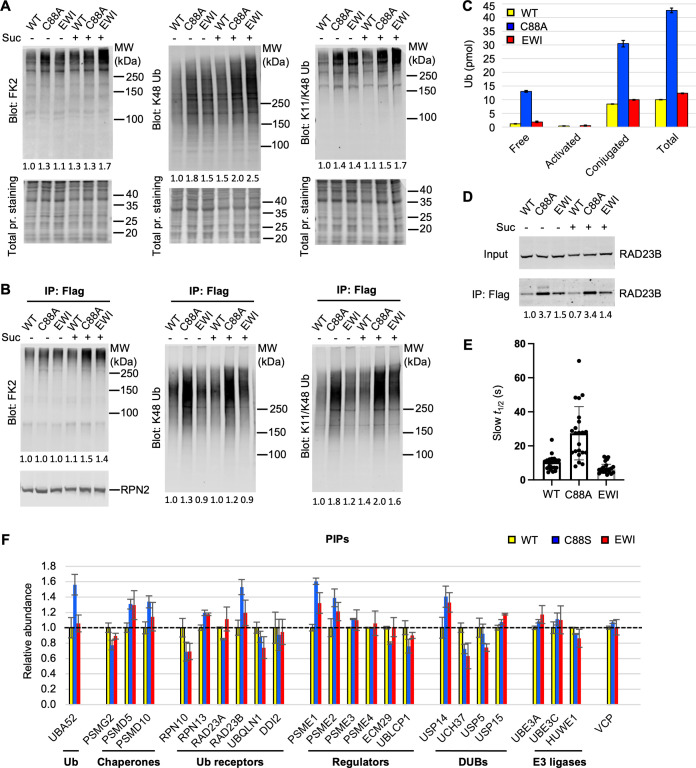
Figure 6—source data 1. Raw western data in Figure 6A, B, D.
elife-72798-fig6-data1.docx (618.9KB, docx)
Figure 6—source data 2. Excel file of fluorescence recovery measurements for each sucrose-induced focus.
elife-72798-fig6-data2.xlsx (115.7KB, xlsx)
Figure 6—source data 3. Excel file of proteomic analyses of UCH37-associated proteasomes by tandem mass tag (TMT).
elife-72798-fig6-data3.xlsx (194.8KB, xlsx)

Figure 6.

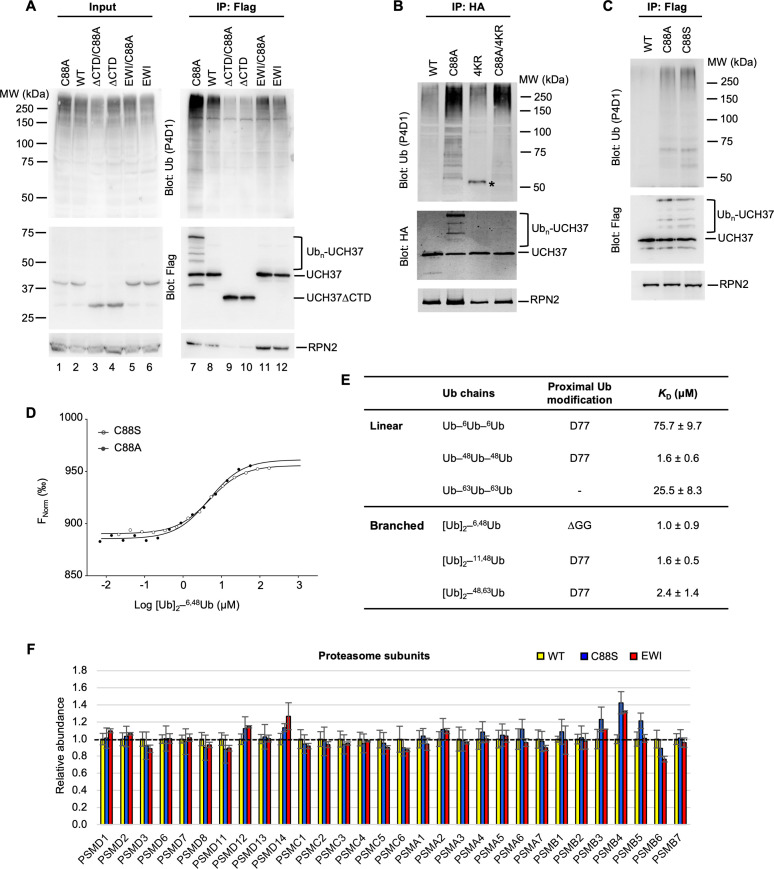
Figure 6—figure supplement 1. UCH37(C88A) and UCH37(C88S)-containing proteasomes accumulate polyUb species.

Figure 6—figure supplement 1.

(A) Analysis of UCH37-containing proteasomes from HEK293 cells. Flp-In T-REx 293 cell lines were constructed to inducibly express different versions of Flag-HA-tagged UCH37. After Dox induction for 48 hr, anti-Flag immunoprecipitates from the cells were analyzed by sodium dodecyl sulphate-polyacrylamide gel electrophoresis (SDS–PAGE) and immunoblotting with the indicated antibodies. (B) Anti-HA immunoprecipitates from cells expressing different versions of HA-tagged UCH37 were analyzed as described in (A). * denotes a non-specific band (IgG heavy chain). (C) Anti-Flag immunoprecipitates from cells inducibly express UCH37 C88A or C88S were analyzed as described in (A). (D) Microscale thermophoresis were performed to determine binding affinities between UCH37(C88A), or UCH37(C88S), and K6/K48-branched Ub3, as described in Figure 2A. (E) Microscale thermophoresis was performed to determine binding affinities between full-length RAD23B and Ub3 chains of different topologies. Shown are best-fit KD values with standard errors from a single-site-binding model. (F) Tandem mass tag (TMT) mass spectrometry analysis of UCH37-containing proteasomes as described in Figure 6F.
Figure 6—figure supplement 1—source data 1. Raw western data in supplement 1A, B, C.