. 2021 Nov 12;10:e71443. doi: 10.7554/eLife.71443

Figure 1. Specific nuclear export sequence (NES) and nuclear localization signal (NLS) control CMK-1 localization in response to temperature in FLP.

(A) Schematic of CMK-1 topology highlighting the localization of in silico-predicted NES and NLS and their sequence. (B) Subcellular localization of CMK-1(wt)::mNeonGreen (mNG) reporter expressed in FLP via the depicted transgene (top). Average nuclear/cytoplasm fluorescent signal ratio (± SEM, left) and representative confocal micrographs (right) showing heat-evoked nuclear translocation of wild-type CMK-1 in young adult FLP neurons after 90 min at 28°C as compared to control at 20°C. (C) Kinetics of CMK-1::mNG nuclear accumulation. Data as nuclear/cytoplasmic fluorescent signal ratio average (± SEM). (D, E) Subcellular localization of CMK-1::mNG reporters carrying the depicted mutations in candidate NES (D), as well as following 90 min incubation with 50 µM leptomycin B or vehicle control (E). Data as nuclear/cytoplasmic signal ratio average (± SEM). (F) Same as for panel (D), but with mutations in the depicted candidate NLS in animals incubated 90 min at 20°C (blue, left panel) or 90 min at 28°C (red, right panel). #p<0.001 versus CMK-1(wt) by Bonferroni contrasts. The number of animals scored in each condition is indicated in the figure (n). Experiments reported in panels (B), (D), and (F) were run in parallel and the CMK-1(wt) dataset is common across these panels.

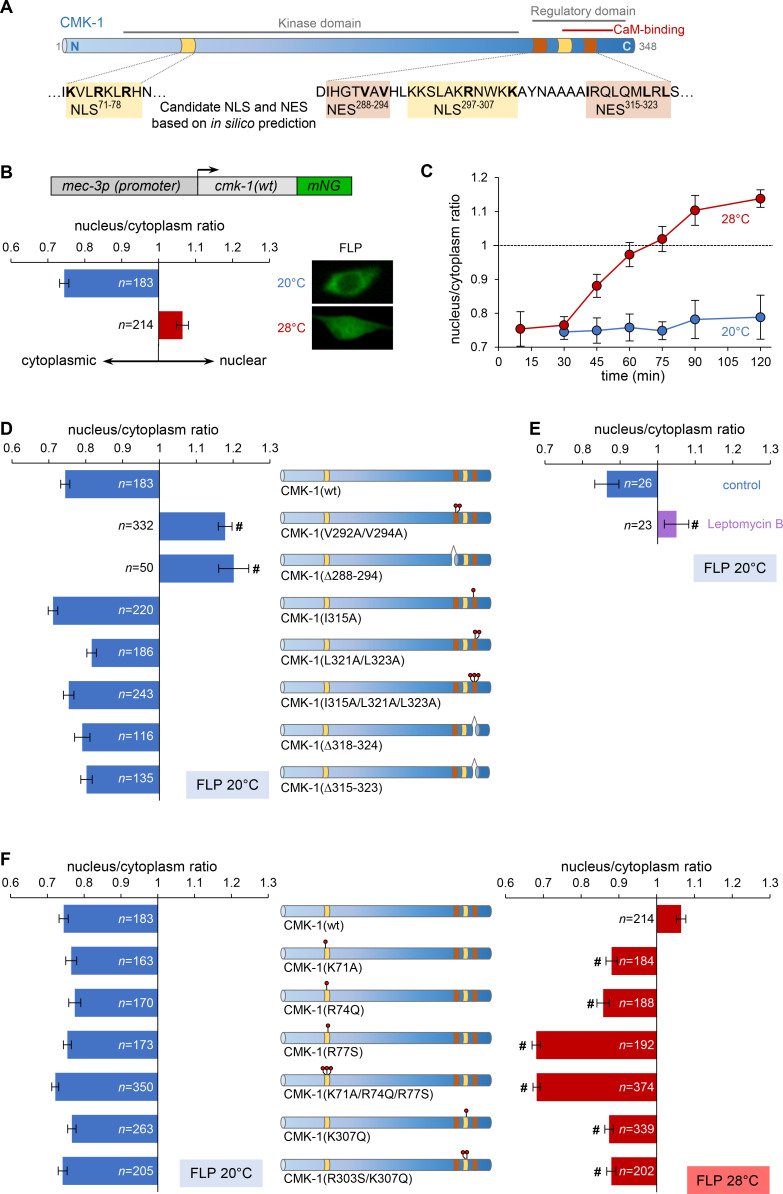
Figure 1—source data 1. Summary statistics and raw data for Figure 1.
elife-71443-fig1-data1.xlsx (254.1KB, xlsx)

Figure 1.

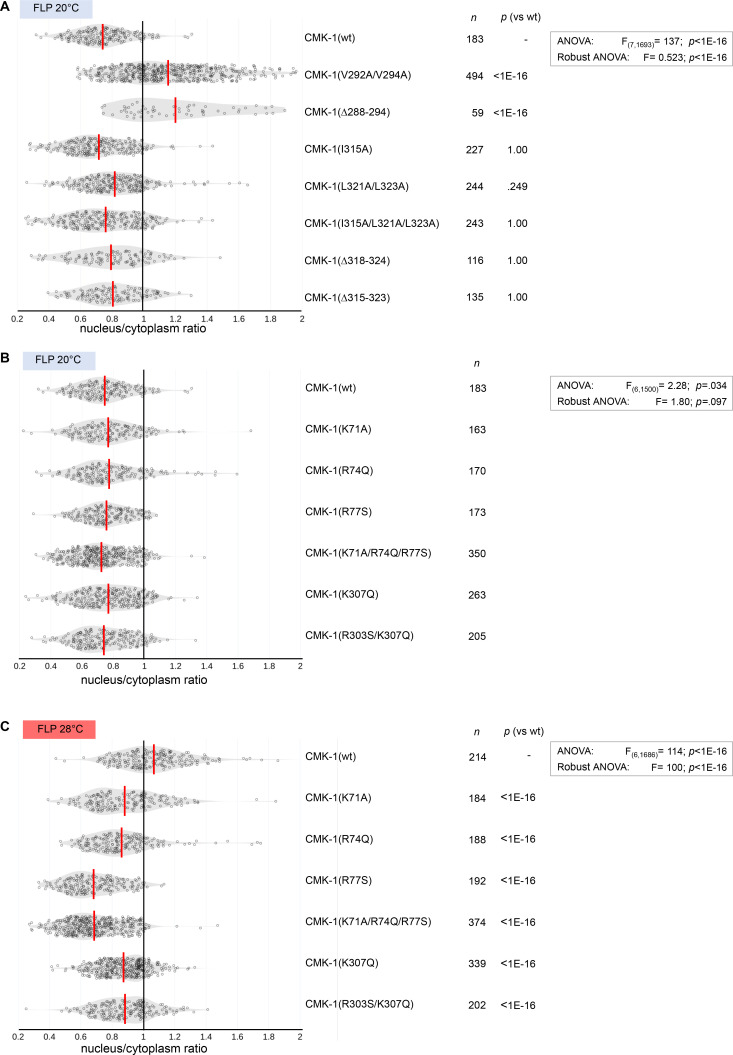
Figure 1—figure supplement 1. CMK-1 localization data distribution in mutants for nuclear export sequence (NES) and nuclear localization signal (NLS) candidates.

Figure 1—figure supplement 1.

Violin plots with superimposed datapoints depicting the distribution of nucleus/cytoplasmic ratios of the indicated CMK-1::mNG reporters. Red bars: average. n: number of observations. p-Values obtained with Bonferroni post-hoc tests. (A) Data corresponding to Figure 1D. (B) Data corresponding to Figure 1F, left. (C) Data corresponding to Figure 1F, right.
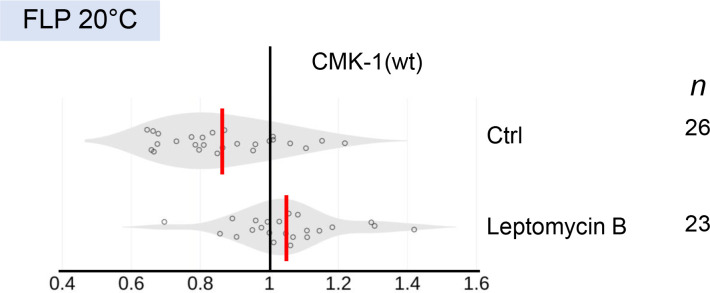
Figure 1—figure supplement 2. CMK-1 localization data distribution upon leptomycin B treatment.

Figure 1—figure supplement 2.

Violin plots with superimposed datapoints depicting the distributions of nucleus/cytoplasmic ratios of CMK-1(wt)::mNG reporter. Red bars: average. n: number of observations. Data corresponding to Figure 1E.
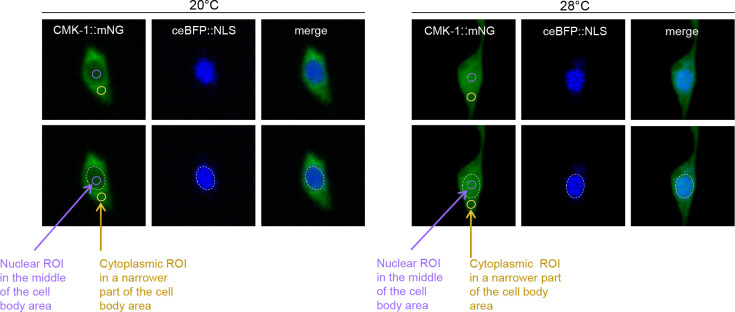
Figure 1—figure supplement 3. Illustration of regions of interest (ROI) definition.

Figure 1—figure supplement 3.

FLP cell body confocal micrography examples from transgenic animals coexpressing CMK-1::mNG reporter (green channel) and the ceBFP::NLS nuclear marker (blue channel) and incubated at the indicated temperature for 90 min. Dotted ellipse: nucleus shapes. Purple ellipse: nuclear ROI. Yellow ellipse: cytoplasmic ROI.