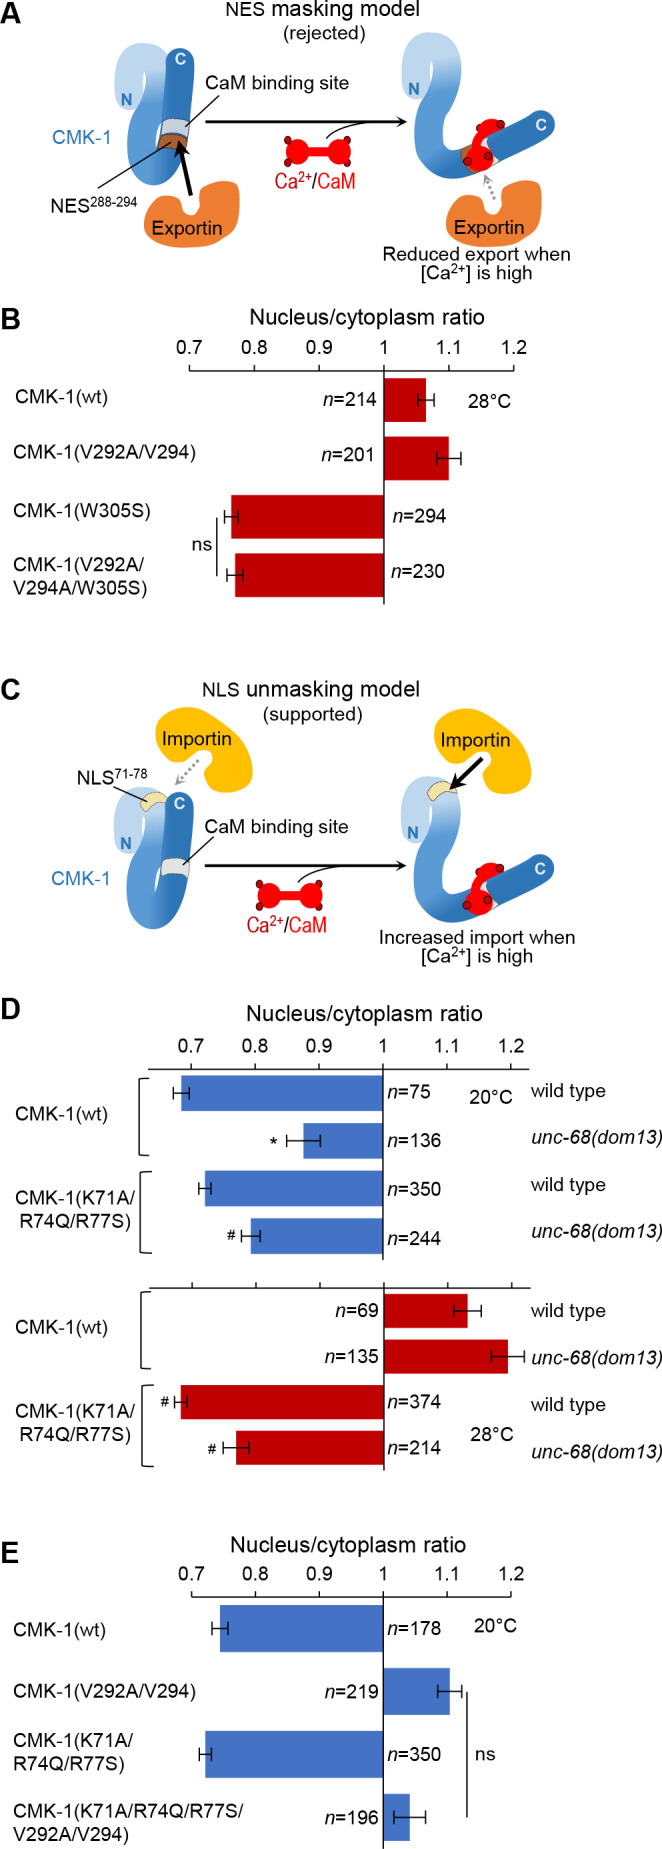
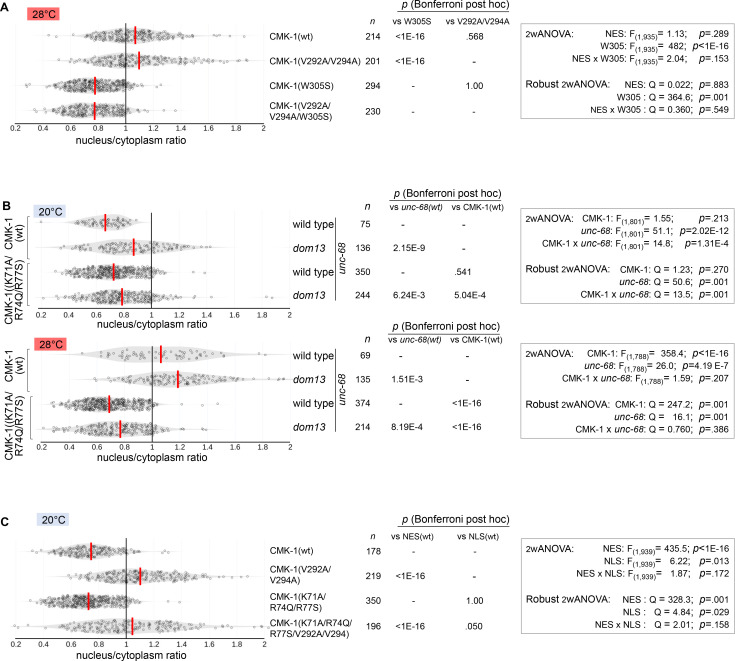
Figure 3. In vivo tests for nuclear export sequence (NES) masking and nuclear localization signal (NLS) unmasking models.
(A) Schematic of the rejected model in which NES288-294 would be masked by Ca2+/CaM binding. (B) Subcellular localization of CMK-1::mNG reporters carrying the indicated mutations in the FLP neurons of animals exposed for 90 min at 28°C. Data as nuclear/cytoplasmic signal ratio average (± SEM), showing that the CaM-binding-disrupting mutation W305S prevents nuclear localization independently of the NES288-294 element. (C) Schematic of the retained model in which NLS71-78 would be unmasked by Ca2+/CaM binding. (D) Subcellular localization of CMK-1(wt)::mNG and the NLS71-78-disrupting mutant CMK-1(K71A/R74Q/R77S)::mNG at 20 and 28°C in both wild-type and unc-68(dom13) backgrounds. Data as nuclear/cytoplasmic signal ratio average (± SEM), showing that the NLS71-78-disrupting mutations counteract the impact of the unc-68 gain-of-function mutation. *p<0.001 versus wild-type; #p<0.001 versus CMK-1(wt) for the corresponding condition by Bonferroni post-hoc tests. Experiments were run in parallel to those reported in Figure 2B, and CMK-1(wt) data are common across the two figures. (E) Subcellular localization of CMK-1::mNG reporters carrying the indicated mutations disrupting either NES288-294, NLS71-78, or both of them. Data as nuclear/cytoplasmic signal ratio average (± SEM), showing no effect of NLS71-78 disruption at 20°C, even when the NES288-294 is impaired. ns, not significant.


