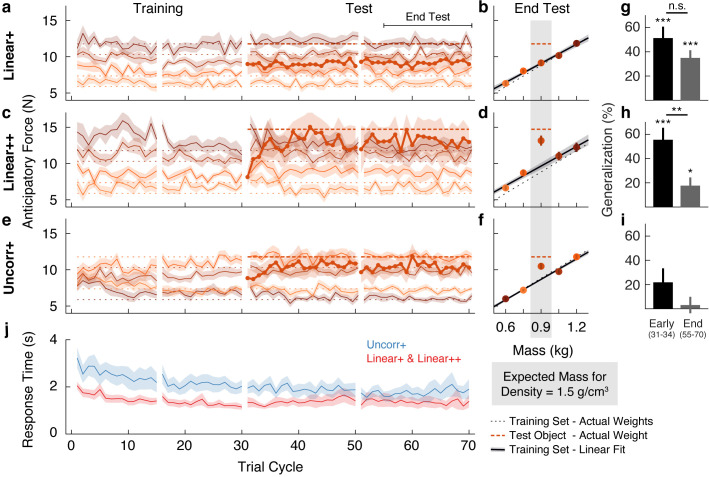
Figure 2. Objects are encoded according to the object families hypothesis.
(a) Trial-by-trial anticipatory forces for the five objects over the course of the Linear+ condition (mean ± SEM). The training objects (thin lines) are experienced from the first trial cycle and the test object (thick line) is introduced on trial cycle 31 as the first trial of each cycle. Traces are color-coded with darker shades indicating larger objects and the dashed lines indicate the associated actual object weights (thick dashed line shows outlier weight). Rest breaks are indicated by gaps in the traces. (b) Anticipatory forces at the end of the test phase for the Linear+ condition (mean ± SEM). The abscissa shows the weights of the training objects and, for the outlier, the expected weight based on the family density. The weights of the training objects lie on the dotted unity line. Dashed horizontal line shows the weight of the outlier. Regression line shows the average of the participants’ linear regressions ± SEM. (c, d) Same as (a, b) for the Linear++ condition. (e, f) Same as (a, b) for the Uncorr+ condition. Note that for each participant, the uncorrelated mapping of size and weight for the training objects was randomly selected; the shading in (e) and (f) depicts one mapping. In (f) the outlier is plotted at the expected weight based on the family density in the Linear conditions. (g) Single-trial generalization in the first four cycles (Early) and last sixteen cycles (End) of the test phase of the Linear+ condition (mean ± SEM, see Materials and methods for details). (h, i) Same as (g) for the Linear++ and Uncorr+ conditions. (j) Response times averaged over objects in each trial cycle (mean ± SEM). The Linear+ and Linear++ groups are combined in the red trace, as they did not differ on this measure. All SEM are across participants.

