. 2021 Nov 30;10:e70982. doi: 10.7554/eLife.70982

Figure 10. GalT-pHlemon sensor detects endosomal acidification.

HeLa cells were transiently transfected with the ratiometric pH sensor, GalT-pHlemon. (C,F) Cells were stably expressing mApple-Rab5. (B) Cells were incubated with Lysotracker Red (LTR) for 20 min prior to imaging. (A) Images of a representative cell to show Golgi-ribbon distribution of GalT-pHlemon in both YFP and CFP channels as well as cytosolic CFP-filled puncta in CFP channel only, representing highly acidified organelles. (B,C) Images to show CFP puncta mostly positive for LTR (B, arrows) and occasionally positive for Rab5 (C, arrows). (D) Graph to show robust response of GalT-pHlemon sensor to pH 4.5–7.0 range as displayed by YFP/CFP ratio measurements in cells incubated with calibration buffers of specified pH values. Numerical data for all analysed Golgi ROIs is available in Figure 10—source data 1. (E) YFP/CFP measurements of GalT-pHlemon in the Golgi ribbon, endo-/lysosomes (cytosolic CFP puncta), as well as in the enlarged endosomes post 20 min nigericin treatment and 100 min recovery. Numerical data for all analysed organelle ROIs is available in Figure 10—source data 2. (F) Cells were treated with nigericin, washed and imaged over 3 hr. Images show GalT-pHlemon sensor localising to the enlarged transiently Rab5-positive endosome and changing YFP and CFP intensity consistent with endosomal acidification. A time-lapse video of the endosome at 1 min interval is available in Figure 10—video 1.

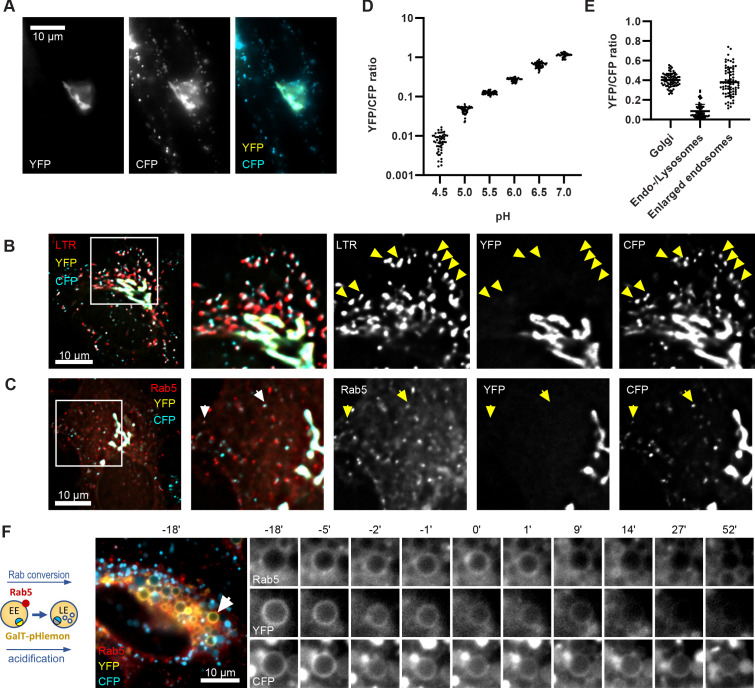
Figure 10—source data 1. Quantification of GalT-pHlemon signal in cells in calibration buffers of known pH.
Figure 10—source data 2. Quantification of GalT-pHlemon signal in Golgi ribbon, endo-/lysosomal puncta, and enlarged endosomes.

Figure 10.

Figure 10—figure supplement 1. GalT-pHlemon sensor responds to pH changes in a sigmoidal dose-response manner, and its puncta exhibit lysosome-like behavior.

Figure 10—figure supplement 1.

HeLa cells were transiently transfected with the ratiometric pH sensor, GalT-pHlemon. (A) Graph to show response of GalT-pHlemon sensor to pH 4.0–9.0 range as displayed by YFP/CFP ratio measurements in cells incubated with calibration buffers of specified pH values as well as the interpolation of sigmoidal dose-response curve. Numerical data for all quantified Golgi ROIs is available in Figure 10—figure supplement 1—source data 1. (B) Cells were treated with nigericin, washed and imaged over 3 hr. Time-lapse images show CFP-filled puncta fuse with the enlarged compartments, which shrink over time to re-obtain near-punctate morphology. A time-lapse video of the endosome at 1 min interval is available in Figure 10—video 1.
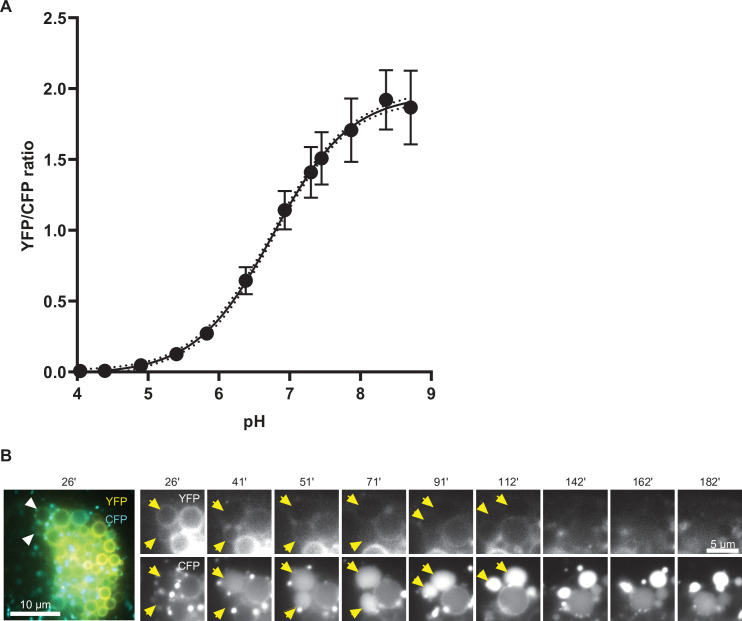
Figure 10—figure supplement 1—source data 1. Sigmoidal dose-response curve to define relationship between GalT-pHlemon signal and pH.
Figure 10—video 1. GalT-pHlemon sensor localising to the enlarged transiently Rab5-positive endosome and changing YFP and CFP intensity consistent with endosomal acidification.
Download video file (539.1KB, mp4)
Figure 10—video 2. CFP-filled puncta fuse with the enlarged compartments, which shrink over time to re-obtain near-punctate morphology.
Download video file (152.3KB, mp4)