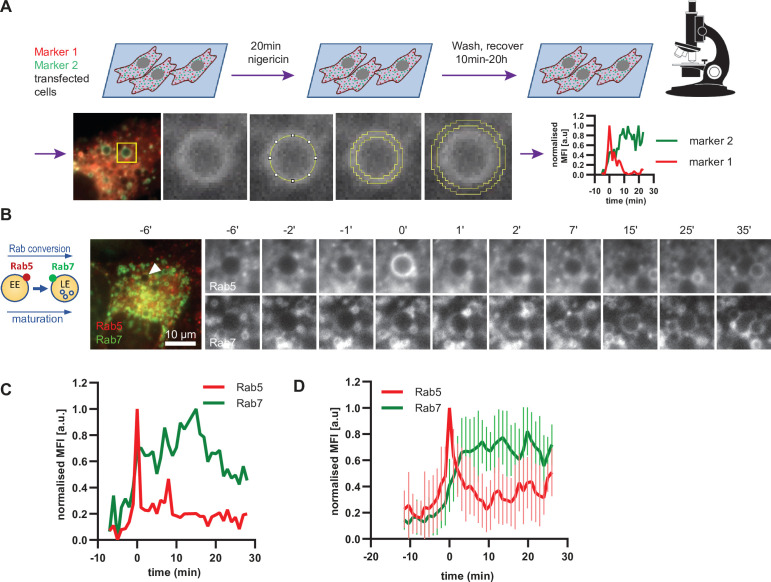
Figure 4. Enlarged endosomes recruit Rab5 and undergo Rab conversion with anticipated kinetics.
(A) Scheme to show experimental flow, starting with transfection of cells of choice with selected markers, followed by short nigericin treatment, and time-lapse microscopy during the recovery phase, with subsequent quantification of mean fluorescence intensity (MFI) of the chosen markers at the rim of the enlarged endosomes, and the resulting kinetic plots of background-subtracted MFI normalised for maximum and minimum values over the entire time course of the endosome. Since endosome maturation is asynchronous, relative time is calculated by using Rab5 peak as a reference for Rab conversion and set to t = 0. The plot shown in the scheme represents the kinetic of the images in Figure 1C (marker one as Rab5 and marker two as Rab7).(B,C,D) HeLa cells, stably expressing mApple-Rab5 and GFP-Rab7 were treated for 20 min with nigericin, washed and imaged over a 3 hr period.(B) Time-lapse images of a representative endosome to show transient Rab5 recruitment and its subsequent displacement by Rab7. (C) Corresponding graph of MFI of Rab5 and Rab7 at the rim of the endosome in (B) during and around the time of Rab conversion. Numerical data for all analyzed endosomes is available in Figure 4—source data 1. (D) Averaged Rab5 and Rab7 kinetics of 27 endosomes. Error bars represent standard deviation. Representative graph of three independent experiments.


